Time & Efforts
Note: To see time and effort distribution analytics that include Guesstimates, you have to have Guesstimates turned on for your users. If Guesstimates are switched off, your data will only include reported hours, or the report will display a message ‘Not enough data to generate the report’.
Efforts Distribution
This analytics report shows where your team’s efforts go. Using the menu on the left, you can choose any period of time to analyze effort and time distribution, and select a specific project or a user you’d like to review these analytics for. If your project includes subfolders or subprojects, you will see effort distribution calculated for each subfolder and subproject. The menu in the top panel allows choosing whether to display data for user-reported time only or to include Guesstimates as well. After selecting your reporting criteria, you will see the effort distribution chart by project as well as the detailed time statistics in the table on the top right.
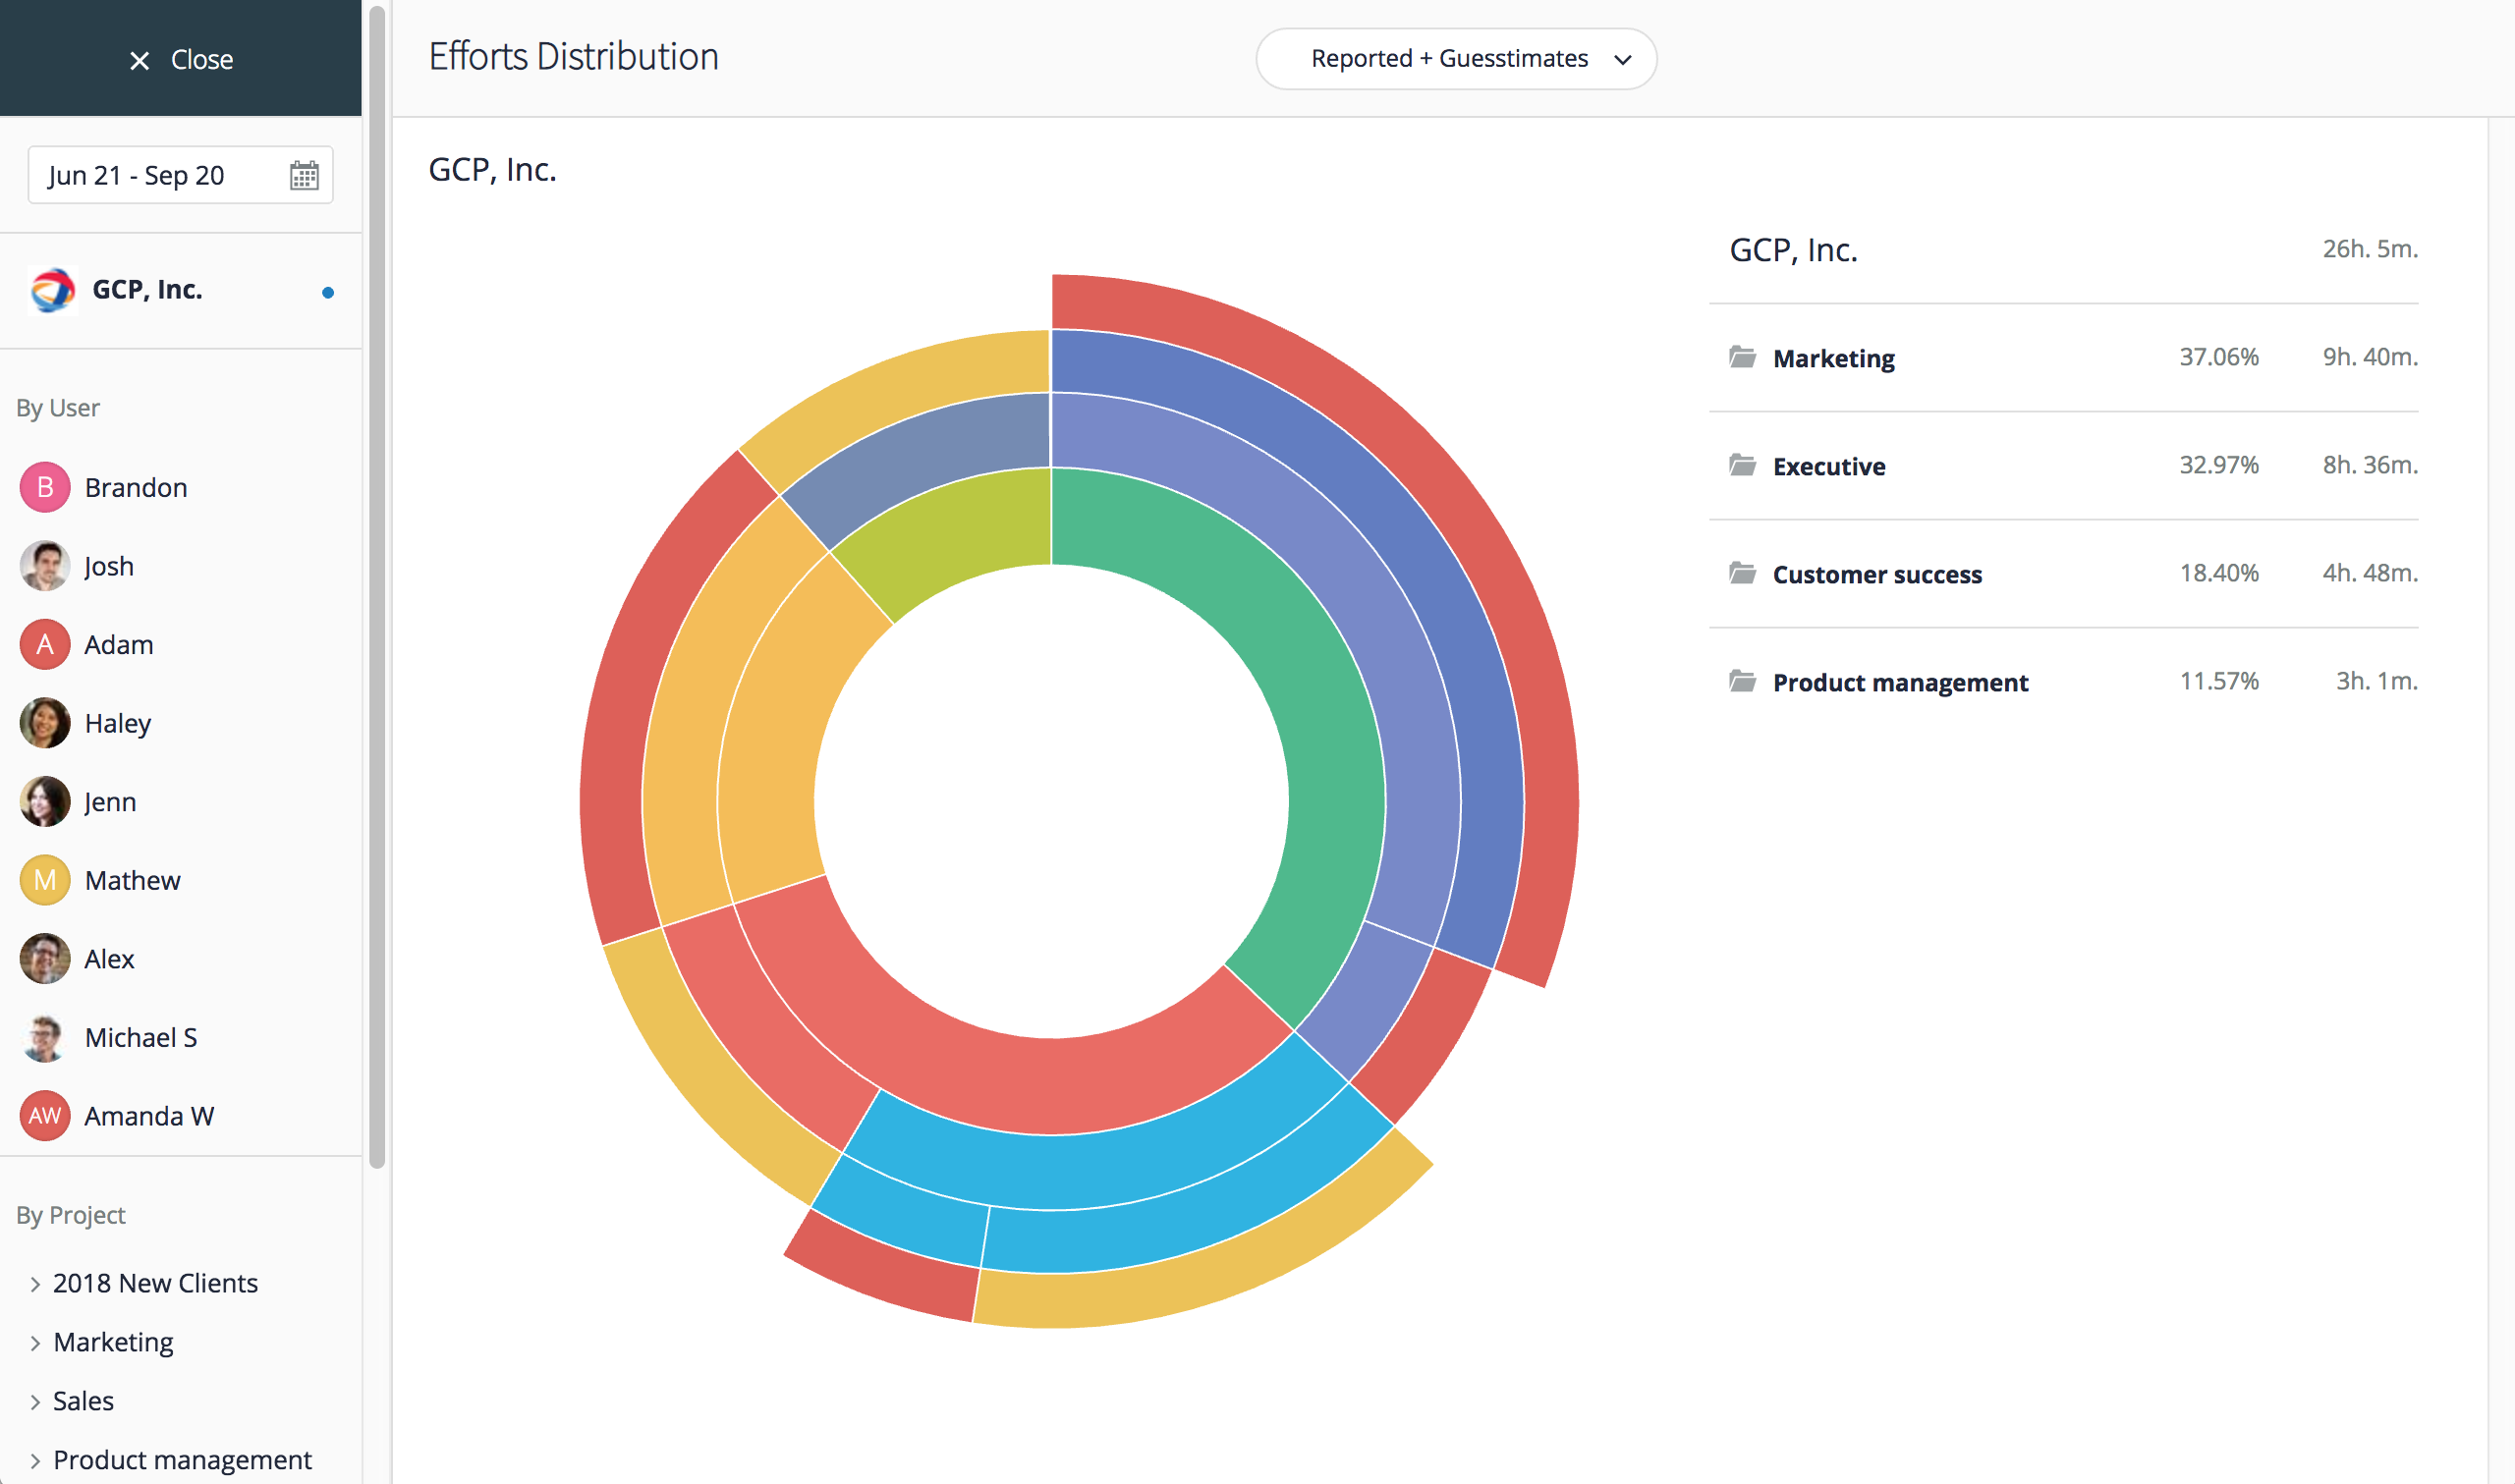
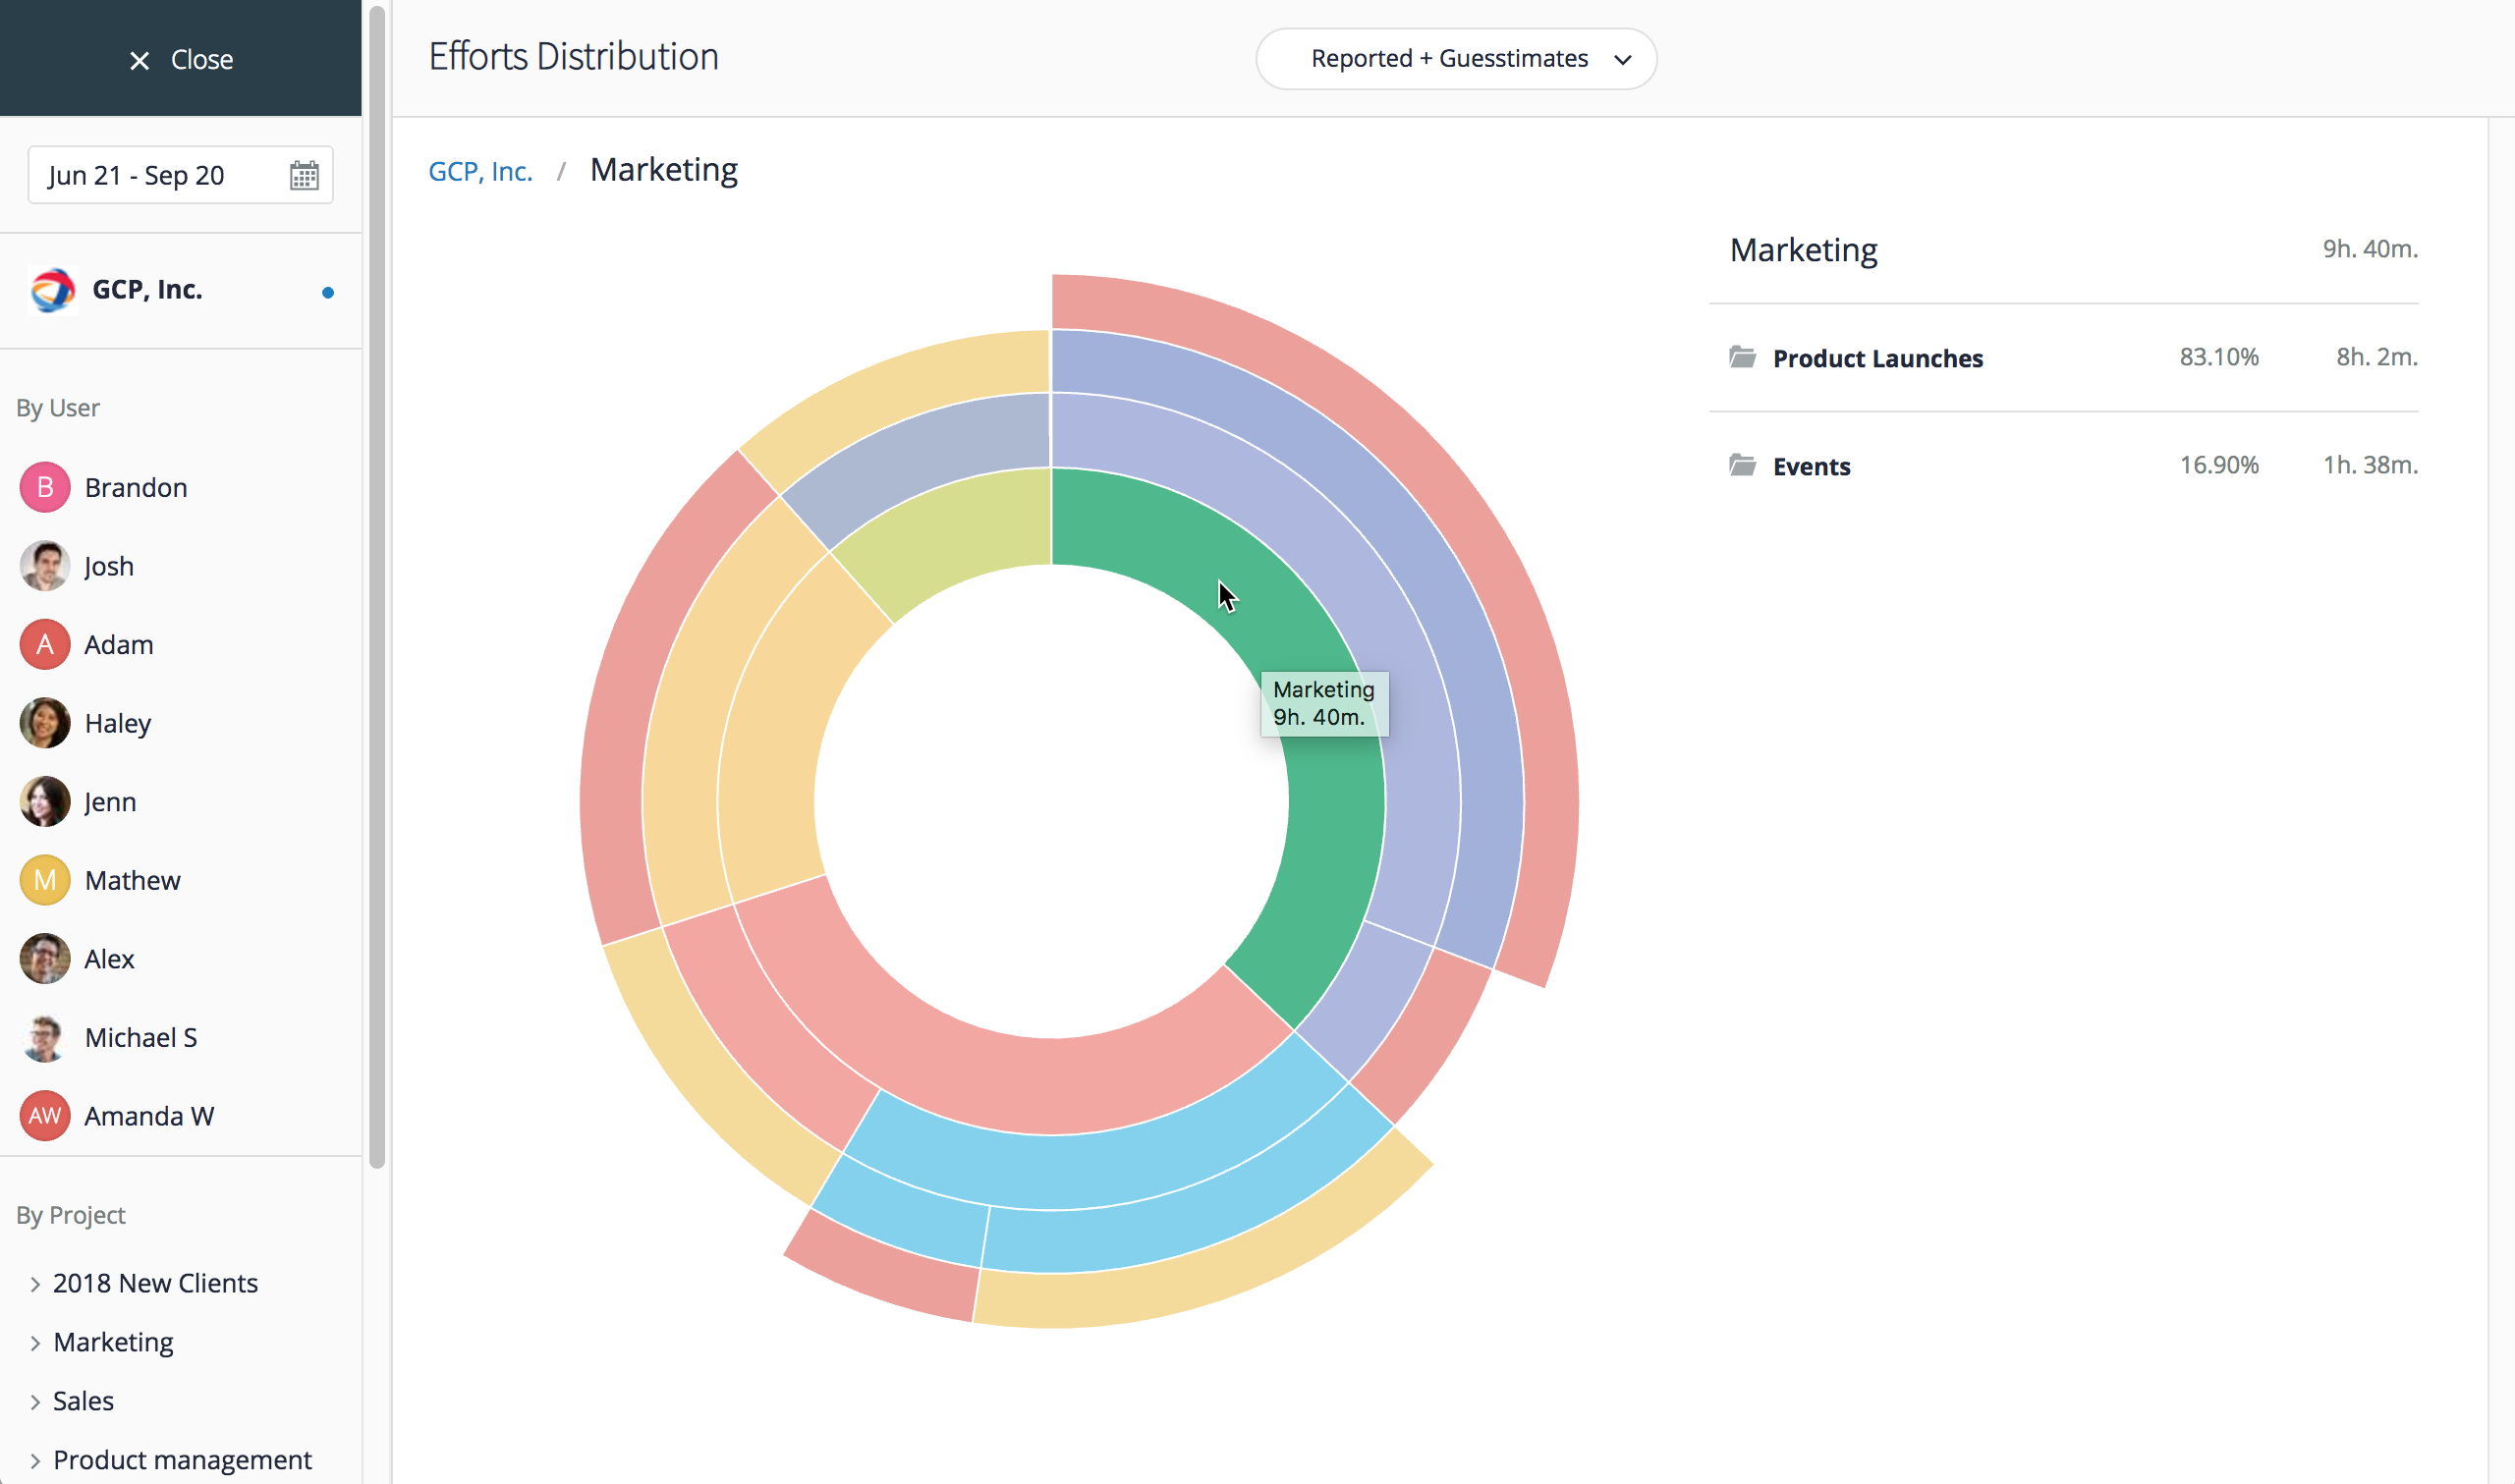
After selecting your reporting criteria, you will see the effort distribution chart by project as well as the detailed time statistics in the table on the top right. Mouse-over a project area on the chart to have the details table on the right display time and effort distribution for all subfolders and subprojects of the selected project.
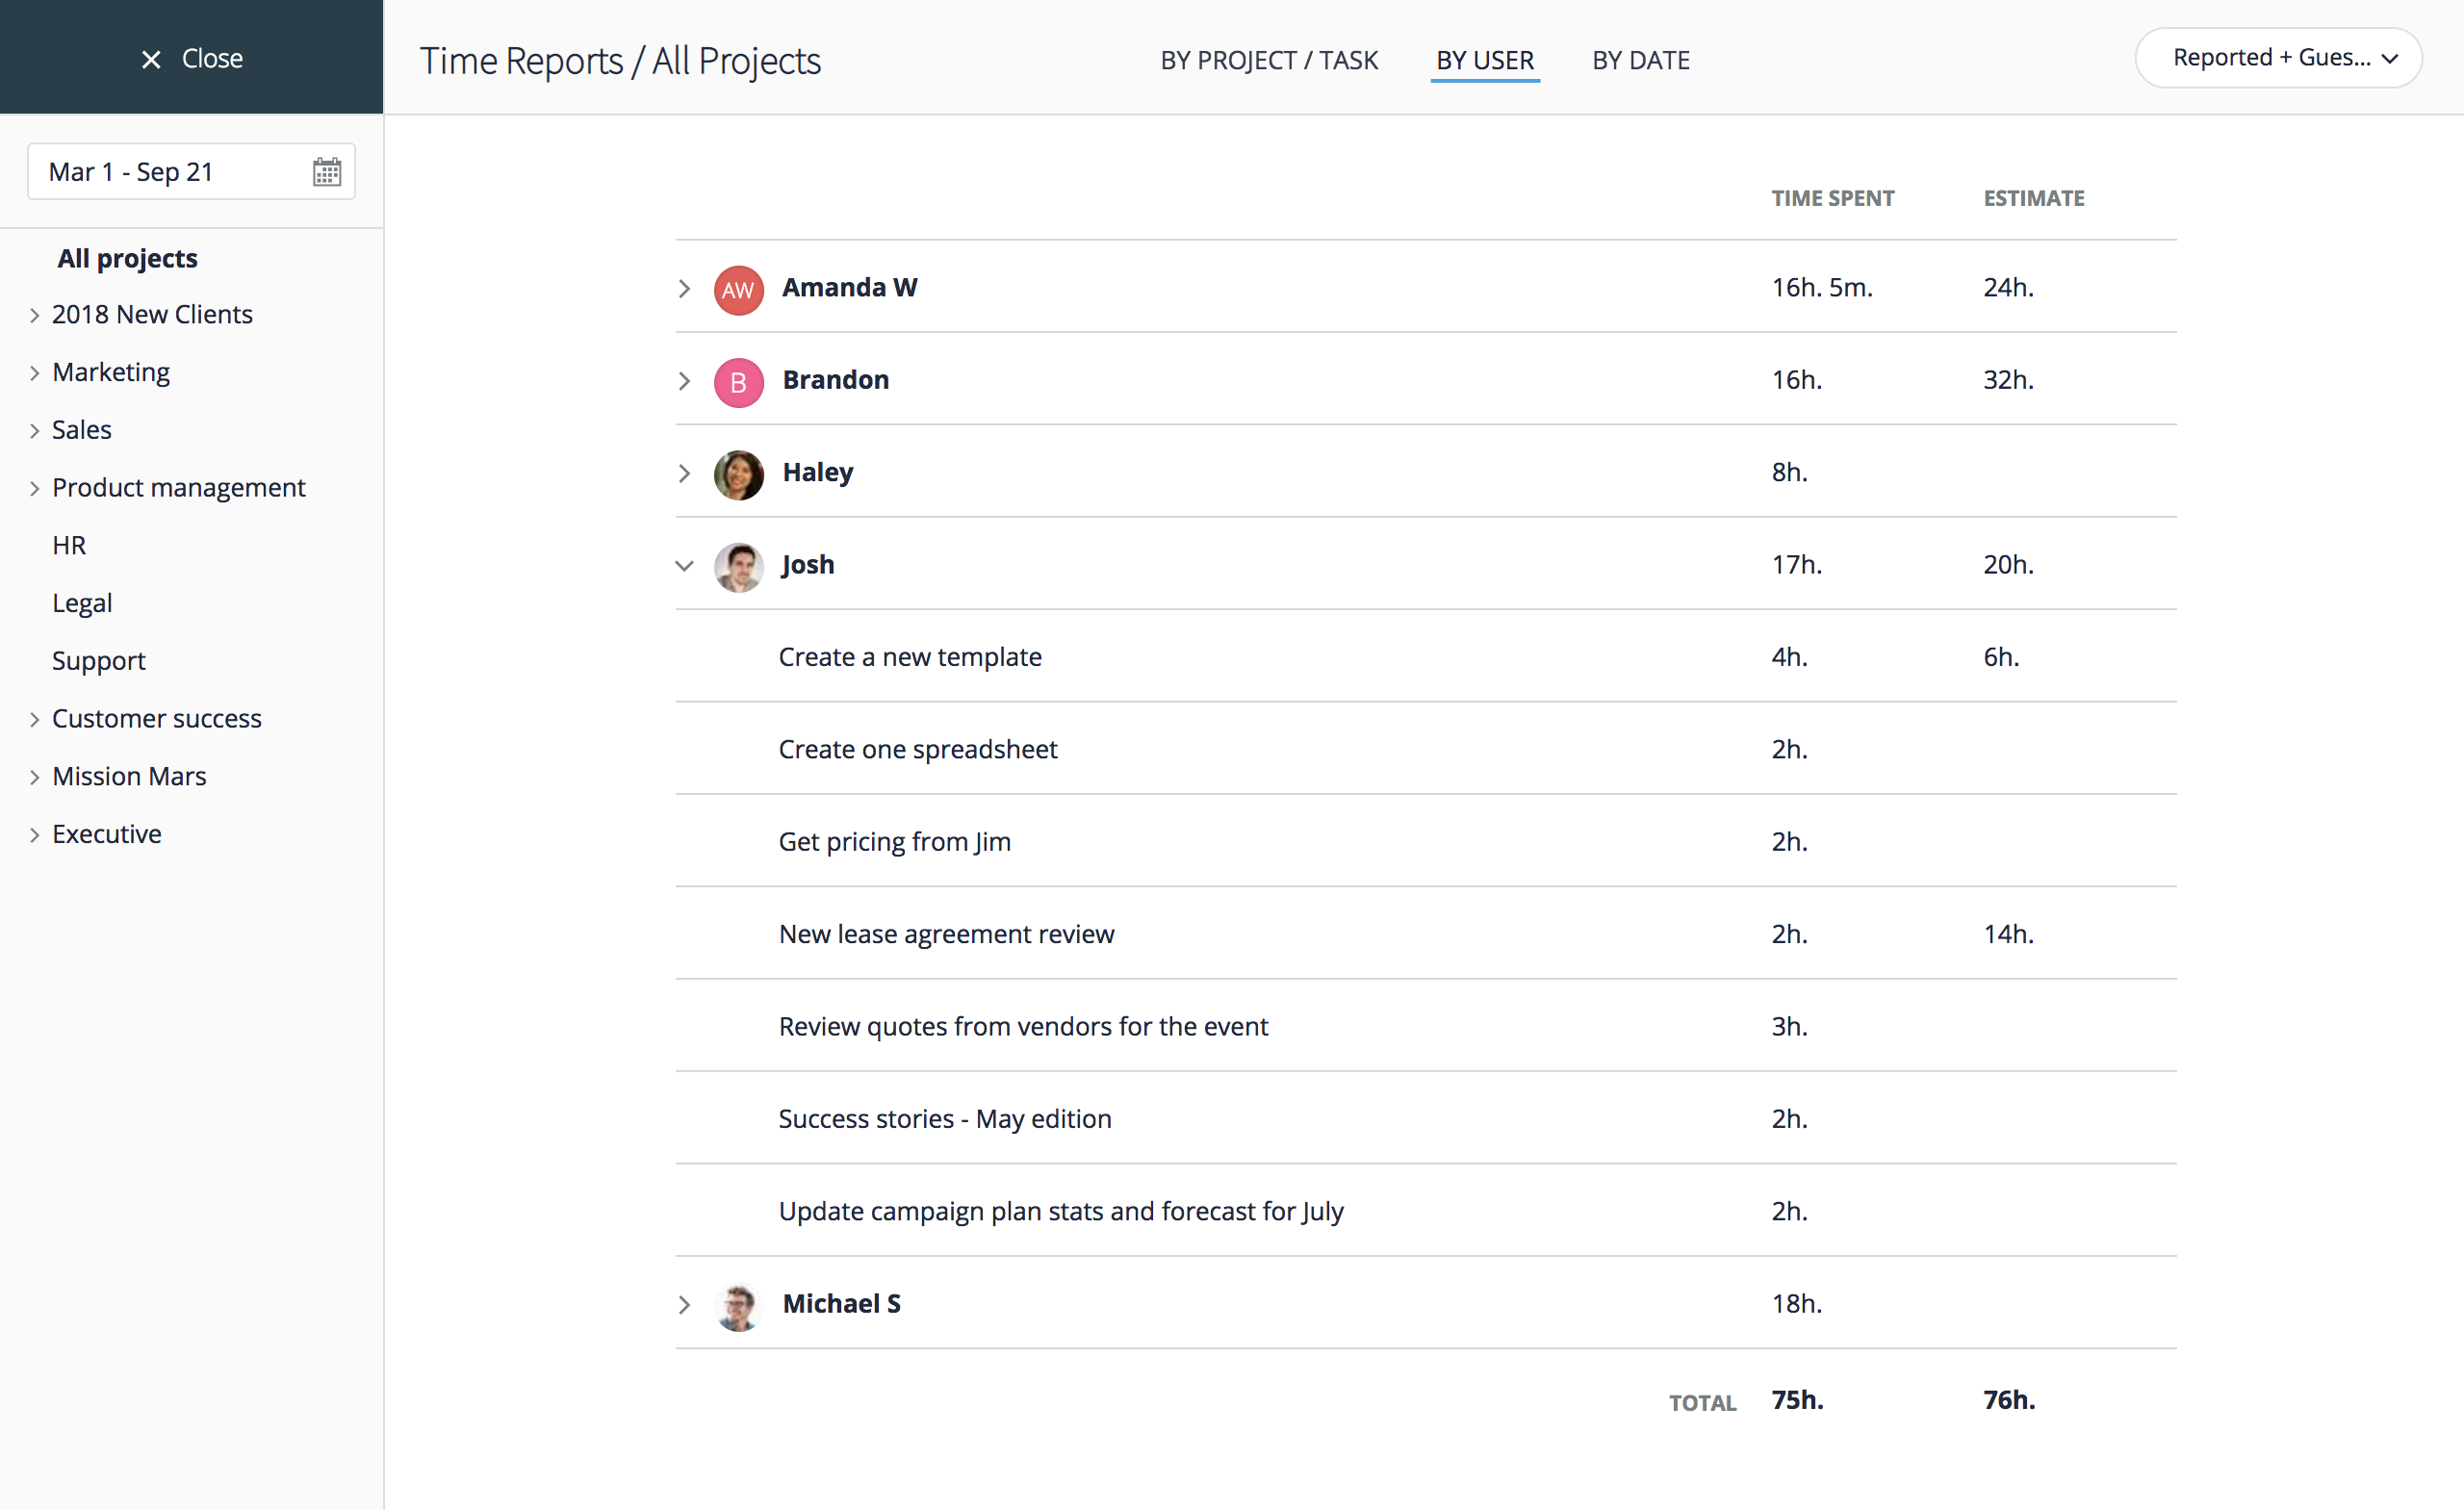
Time Reports by Project
Time Reports by Project provides a detailed view into time spent on each project by any user and for any period of time. First, define your reporting period using the calendar widget in the left menu. Then, you can view time spent on projects grouped either by project, by user, or by date. To switch between these views, click the appropriate menu item in the top menu. You can also use the selector in the top right corner to only display time reported by users or to include Guesstimates as well.
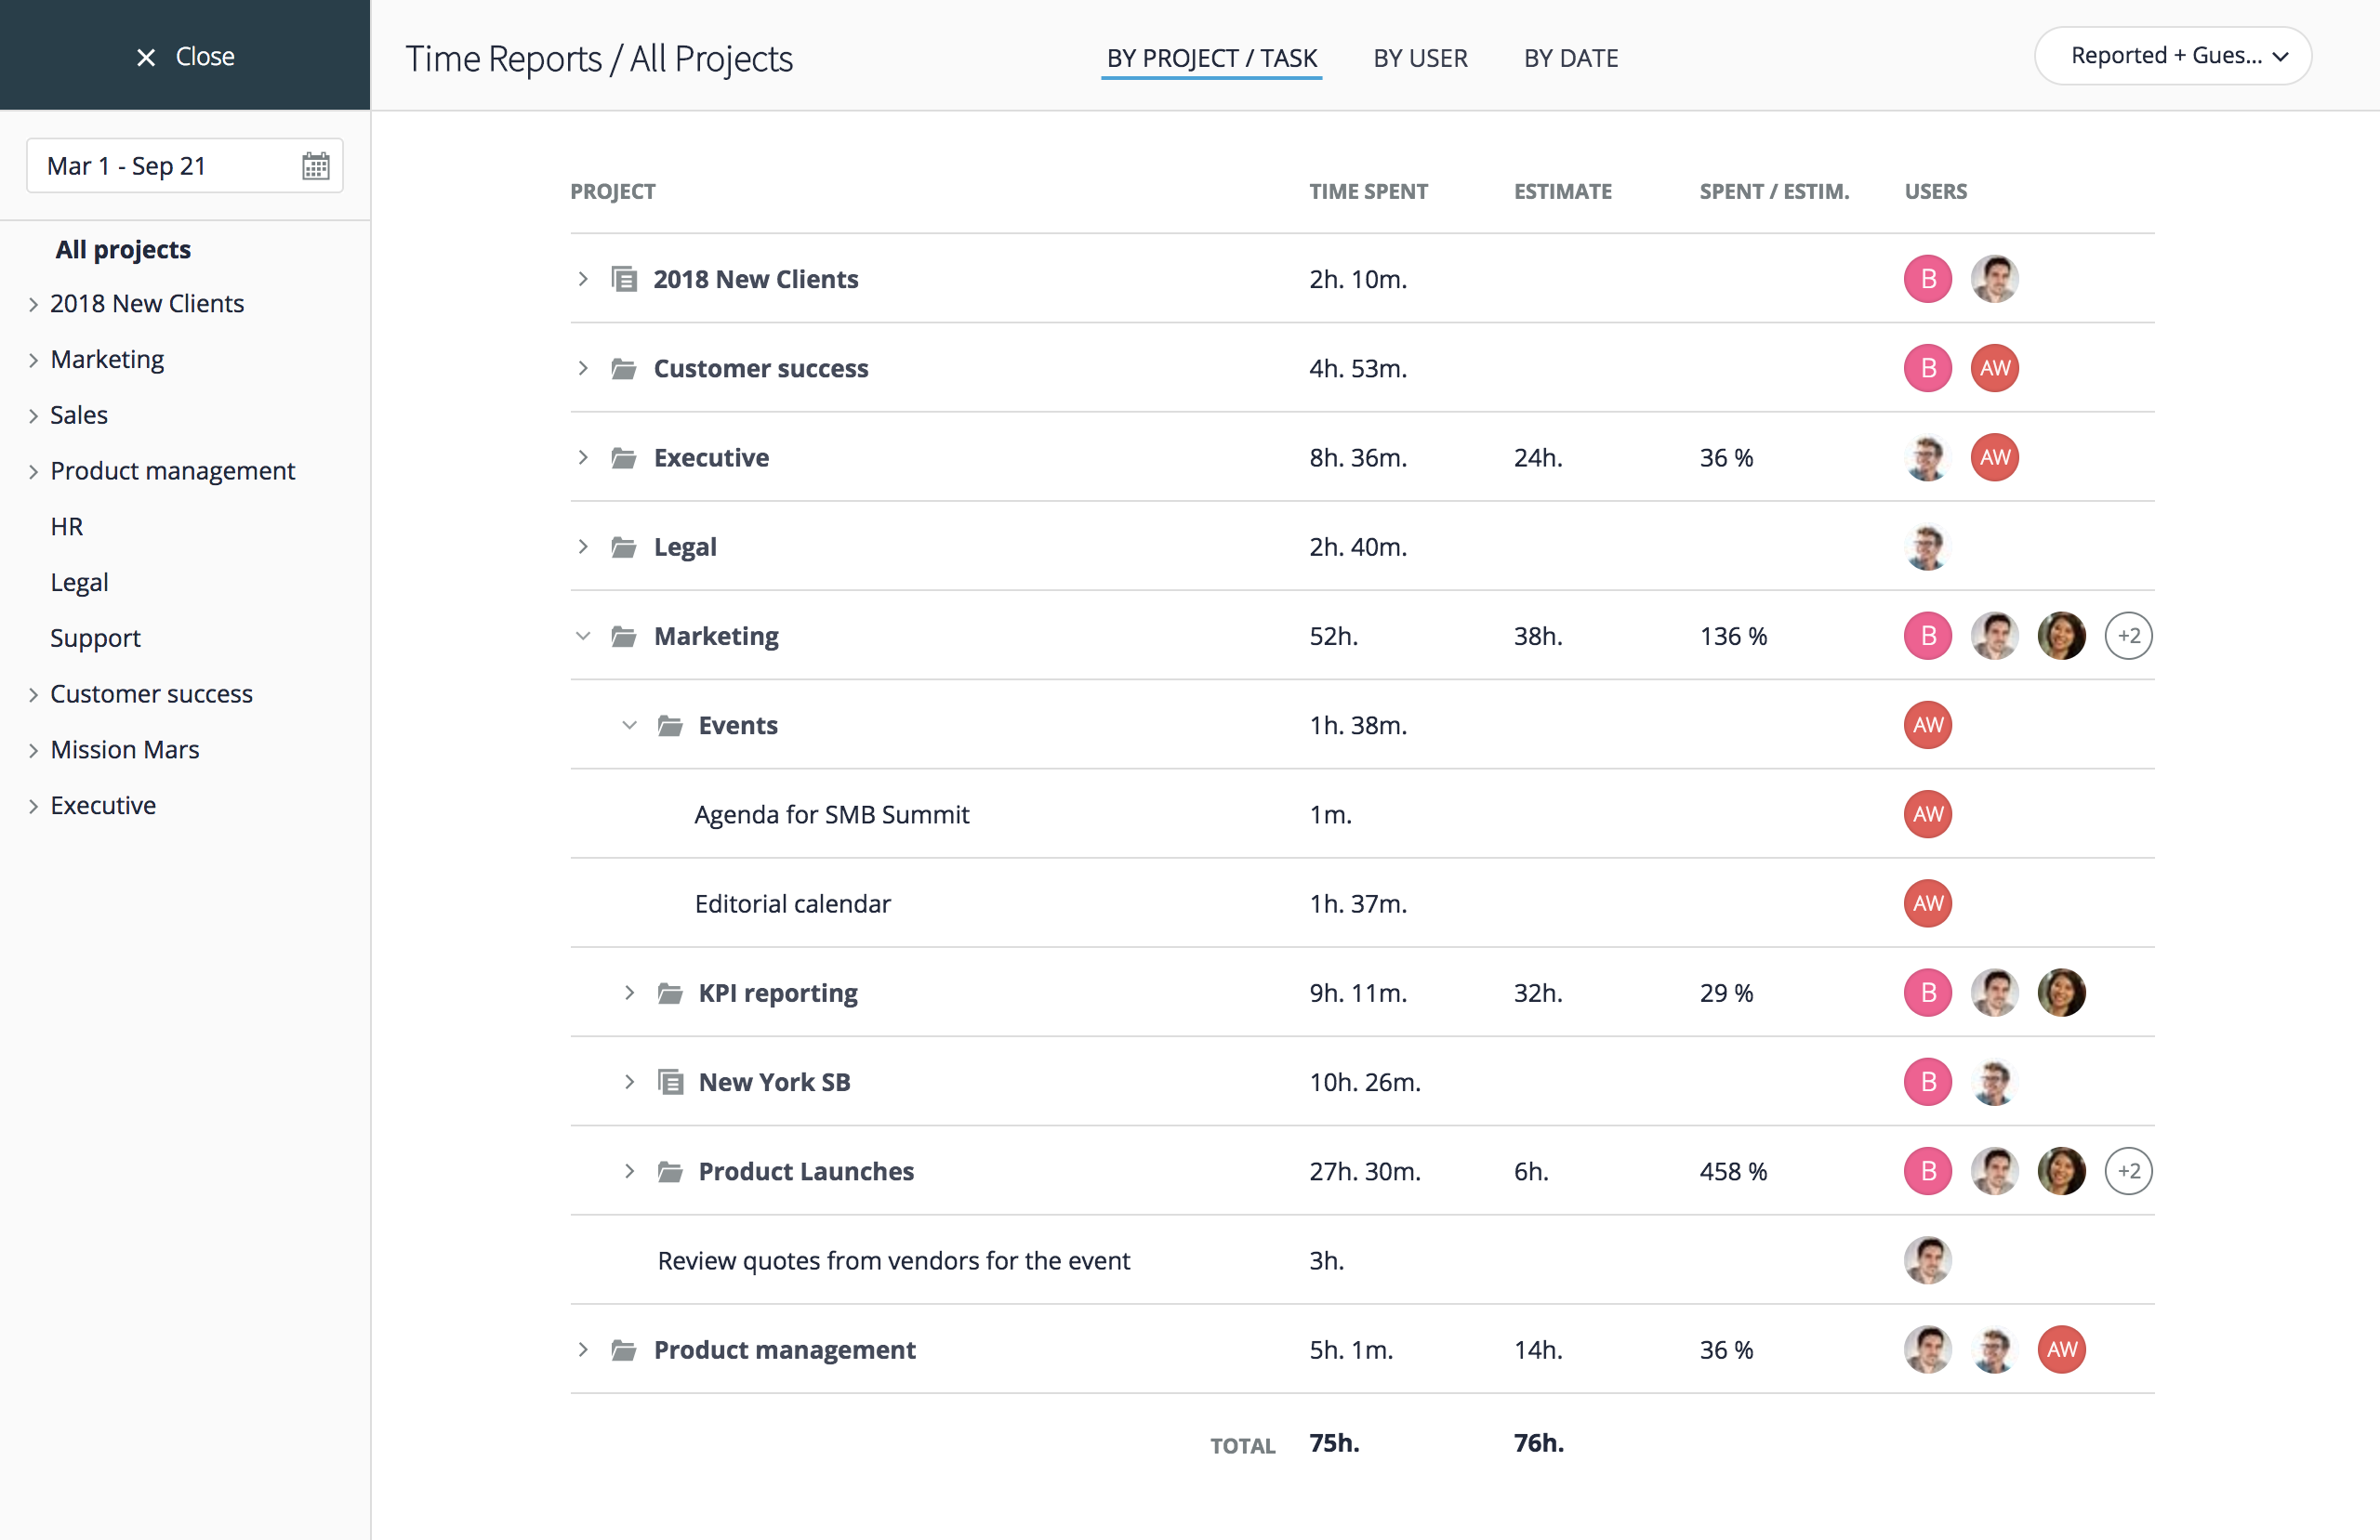
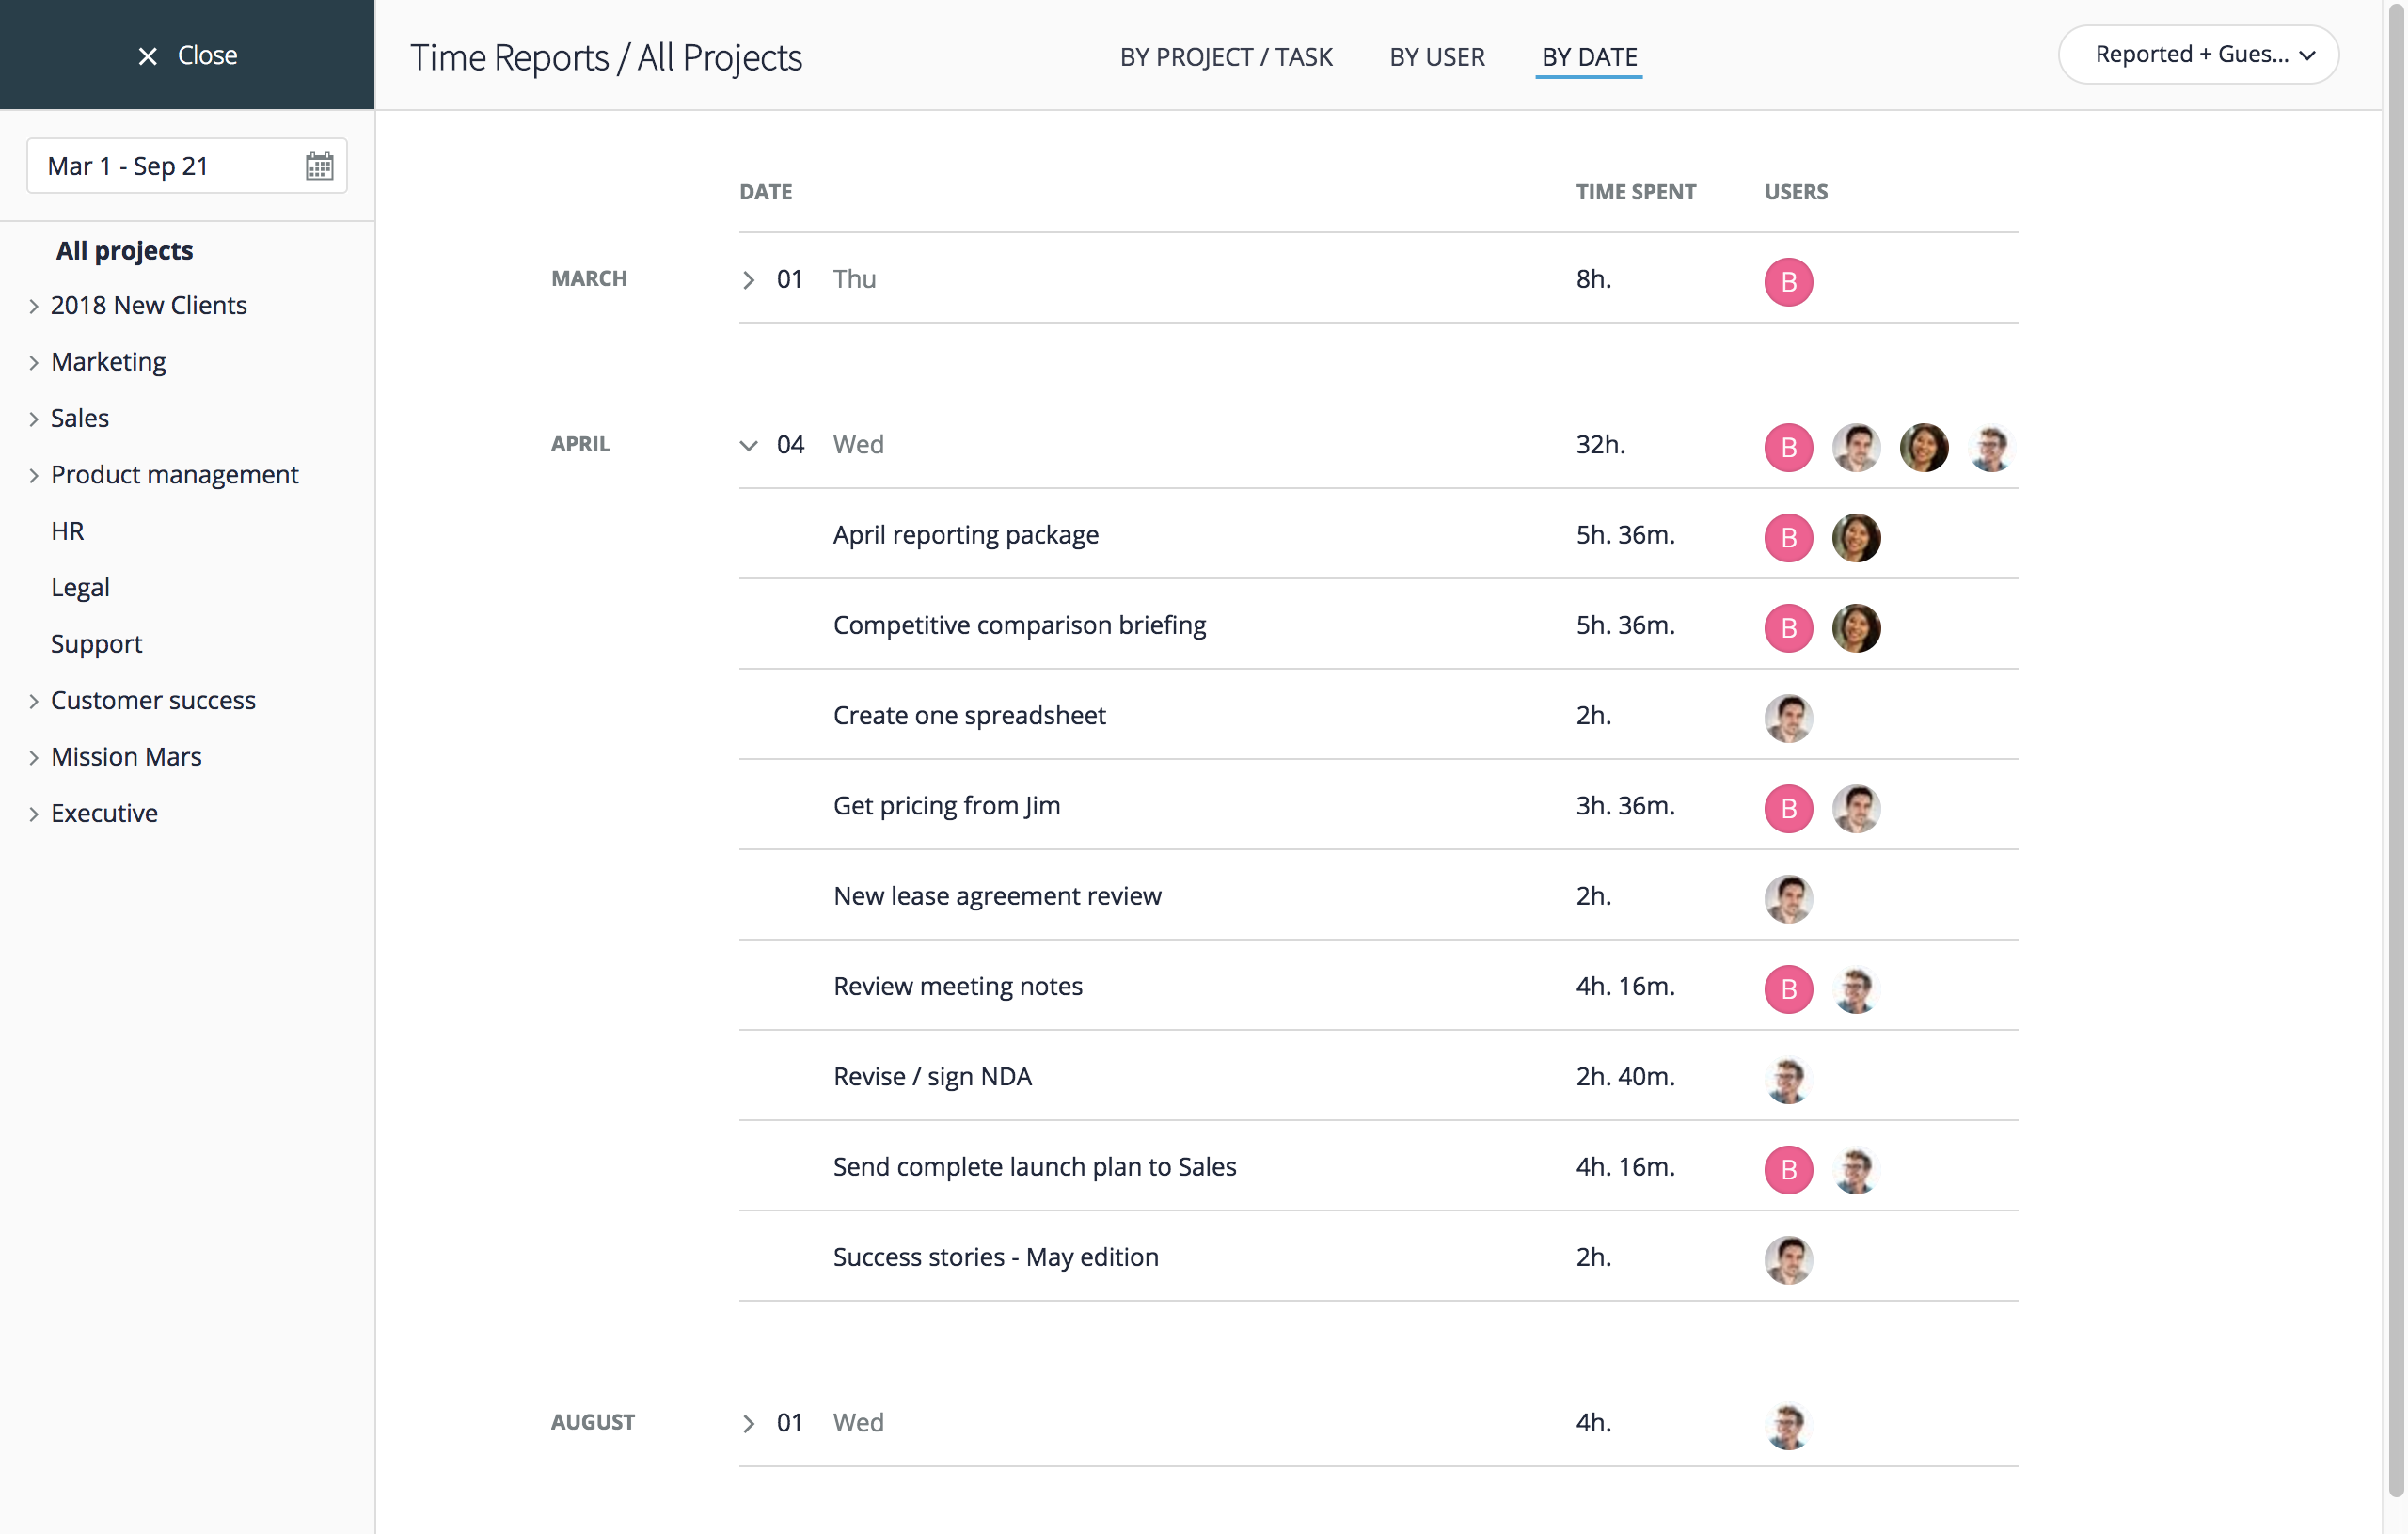
In all views, you can expand projects and folders, or click arrows next to the user or date to expand those groups and display lists of tasks, subprojects and subfolders and time spent for each of these line items. In the Time Spent column, you will see the total time (reported or reported + Guesstimates, depending on your selection), and the Estimate column will always display user-estimated time only. The view By User allows to see where each user’s time went for any period of time.
Using the view By Date, you can see where your team’s time went each day, as well as which users worked on each specific task.
Time Reports by User
In Time Reports by User analytics section, you can focus on time spent on various tasks and projects by user. Use the menu on the left to define your time period, choose a user, and then switch between views By Project or By User to see time spent data. You can also choose whether to see only the user-reported time spent or Guesstimates as well.
Time Reporting
Choose Time Reporting to see a high-level picture of how much time your organization users report and estimate, by user, department, and for any period of time. The charts will show you how many hours were spent in total, by day, how many have been estimated, and how many reported, as well as the % of time spent that was actually reported by all users, a particular user or a department.


