Overview
Tasks Overview
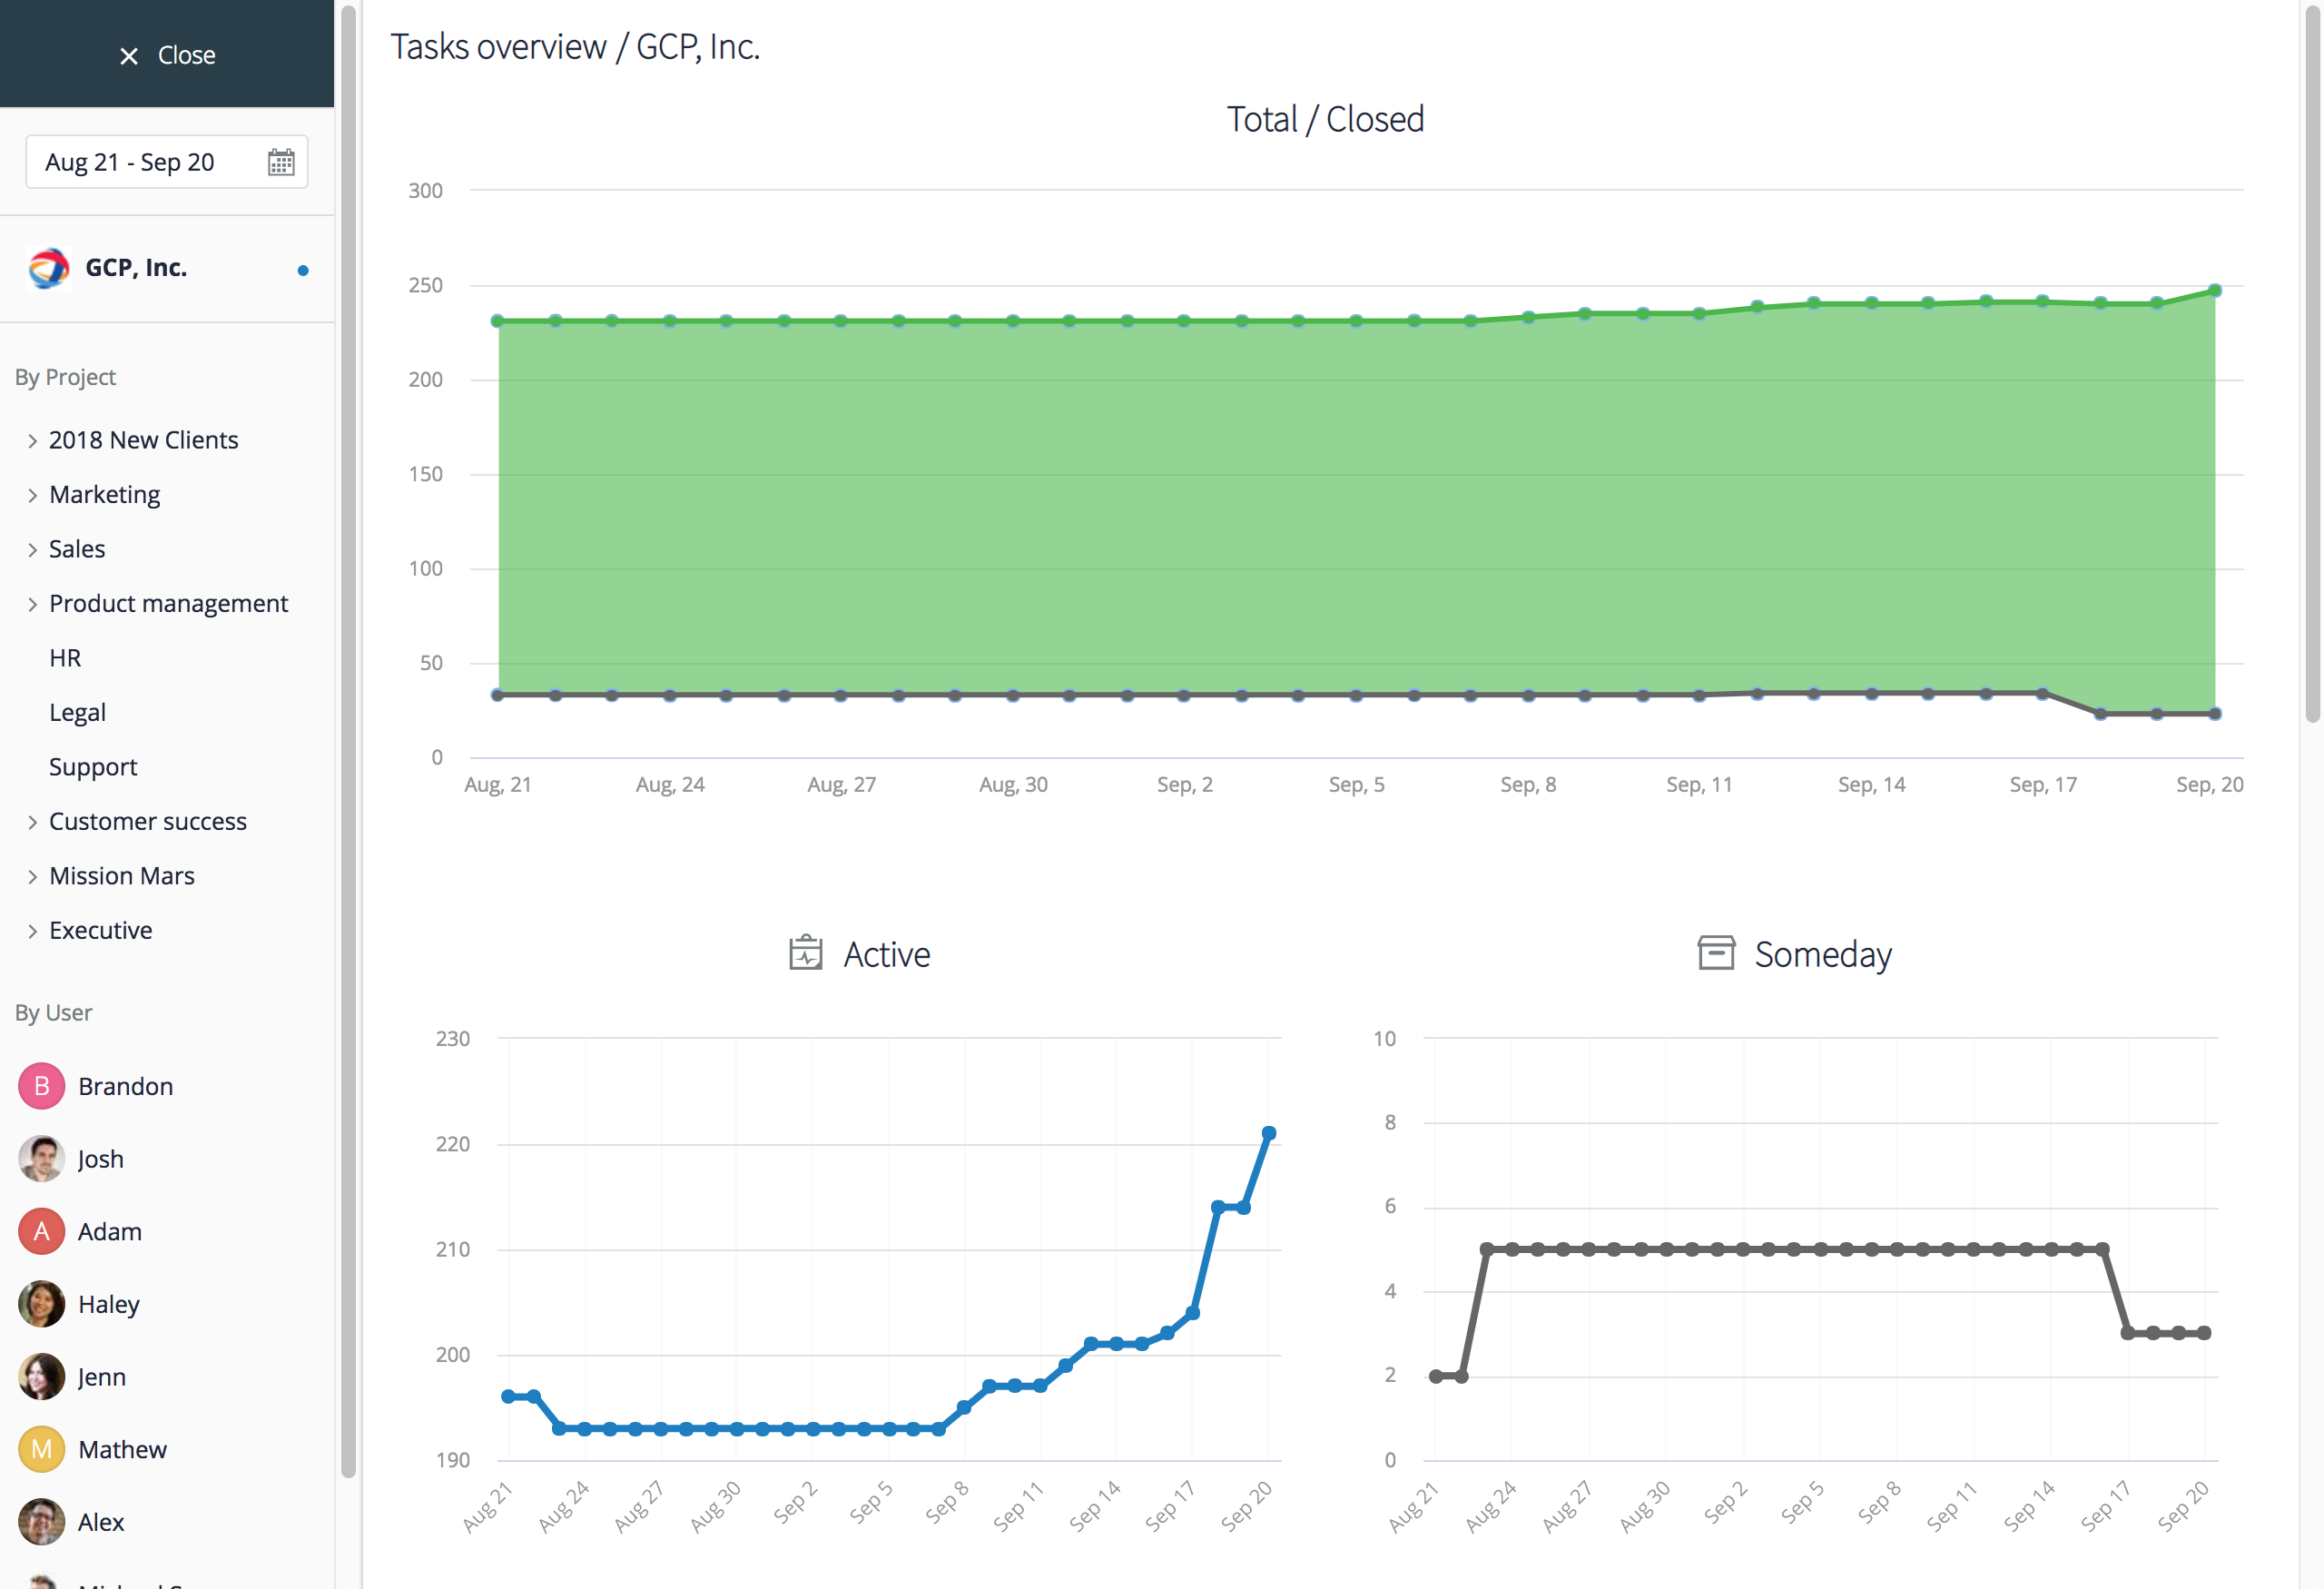
The Task Overview is a quick snapshot of task activity for your organization. You can see how many tasks have been created and closed, how many were active on a particular day, or how many are scheduled for someday. These analytics can be filtered by time period, user, or project and, if you mouse-over any data point on the graphs, you will see more details.
Tasks Progress Report
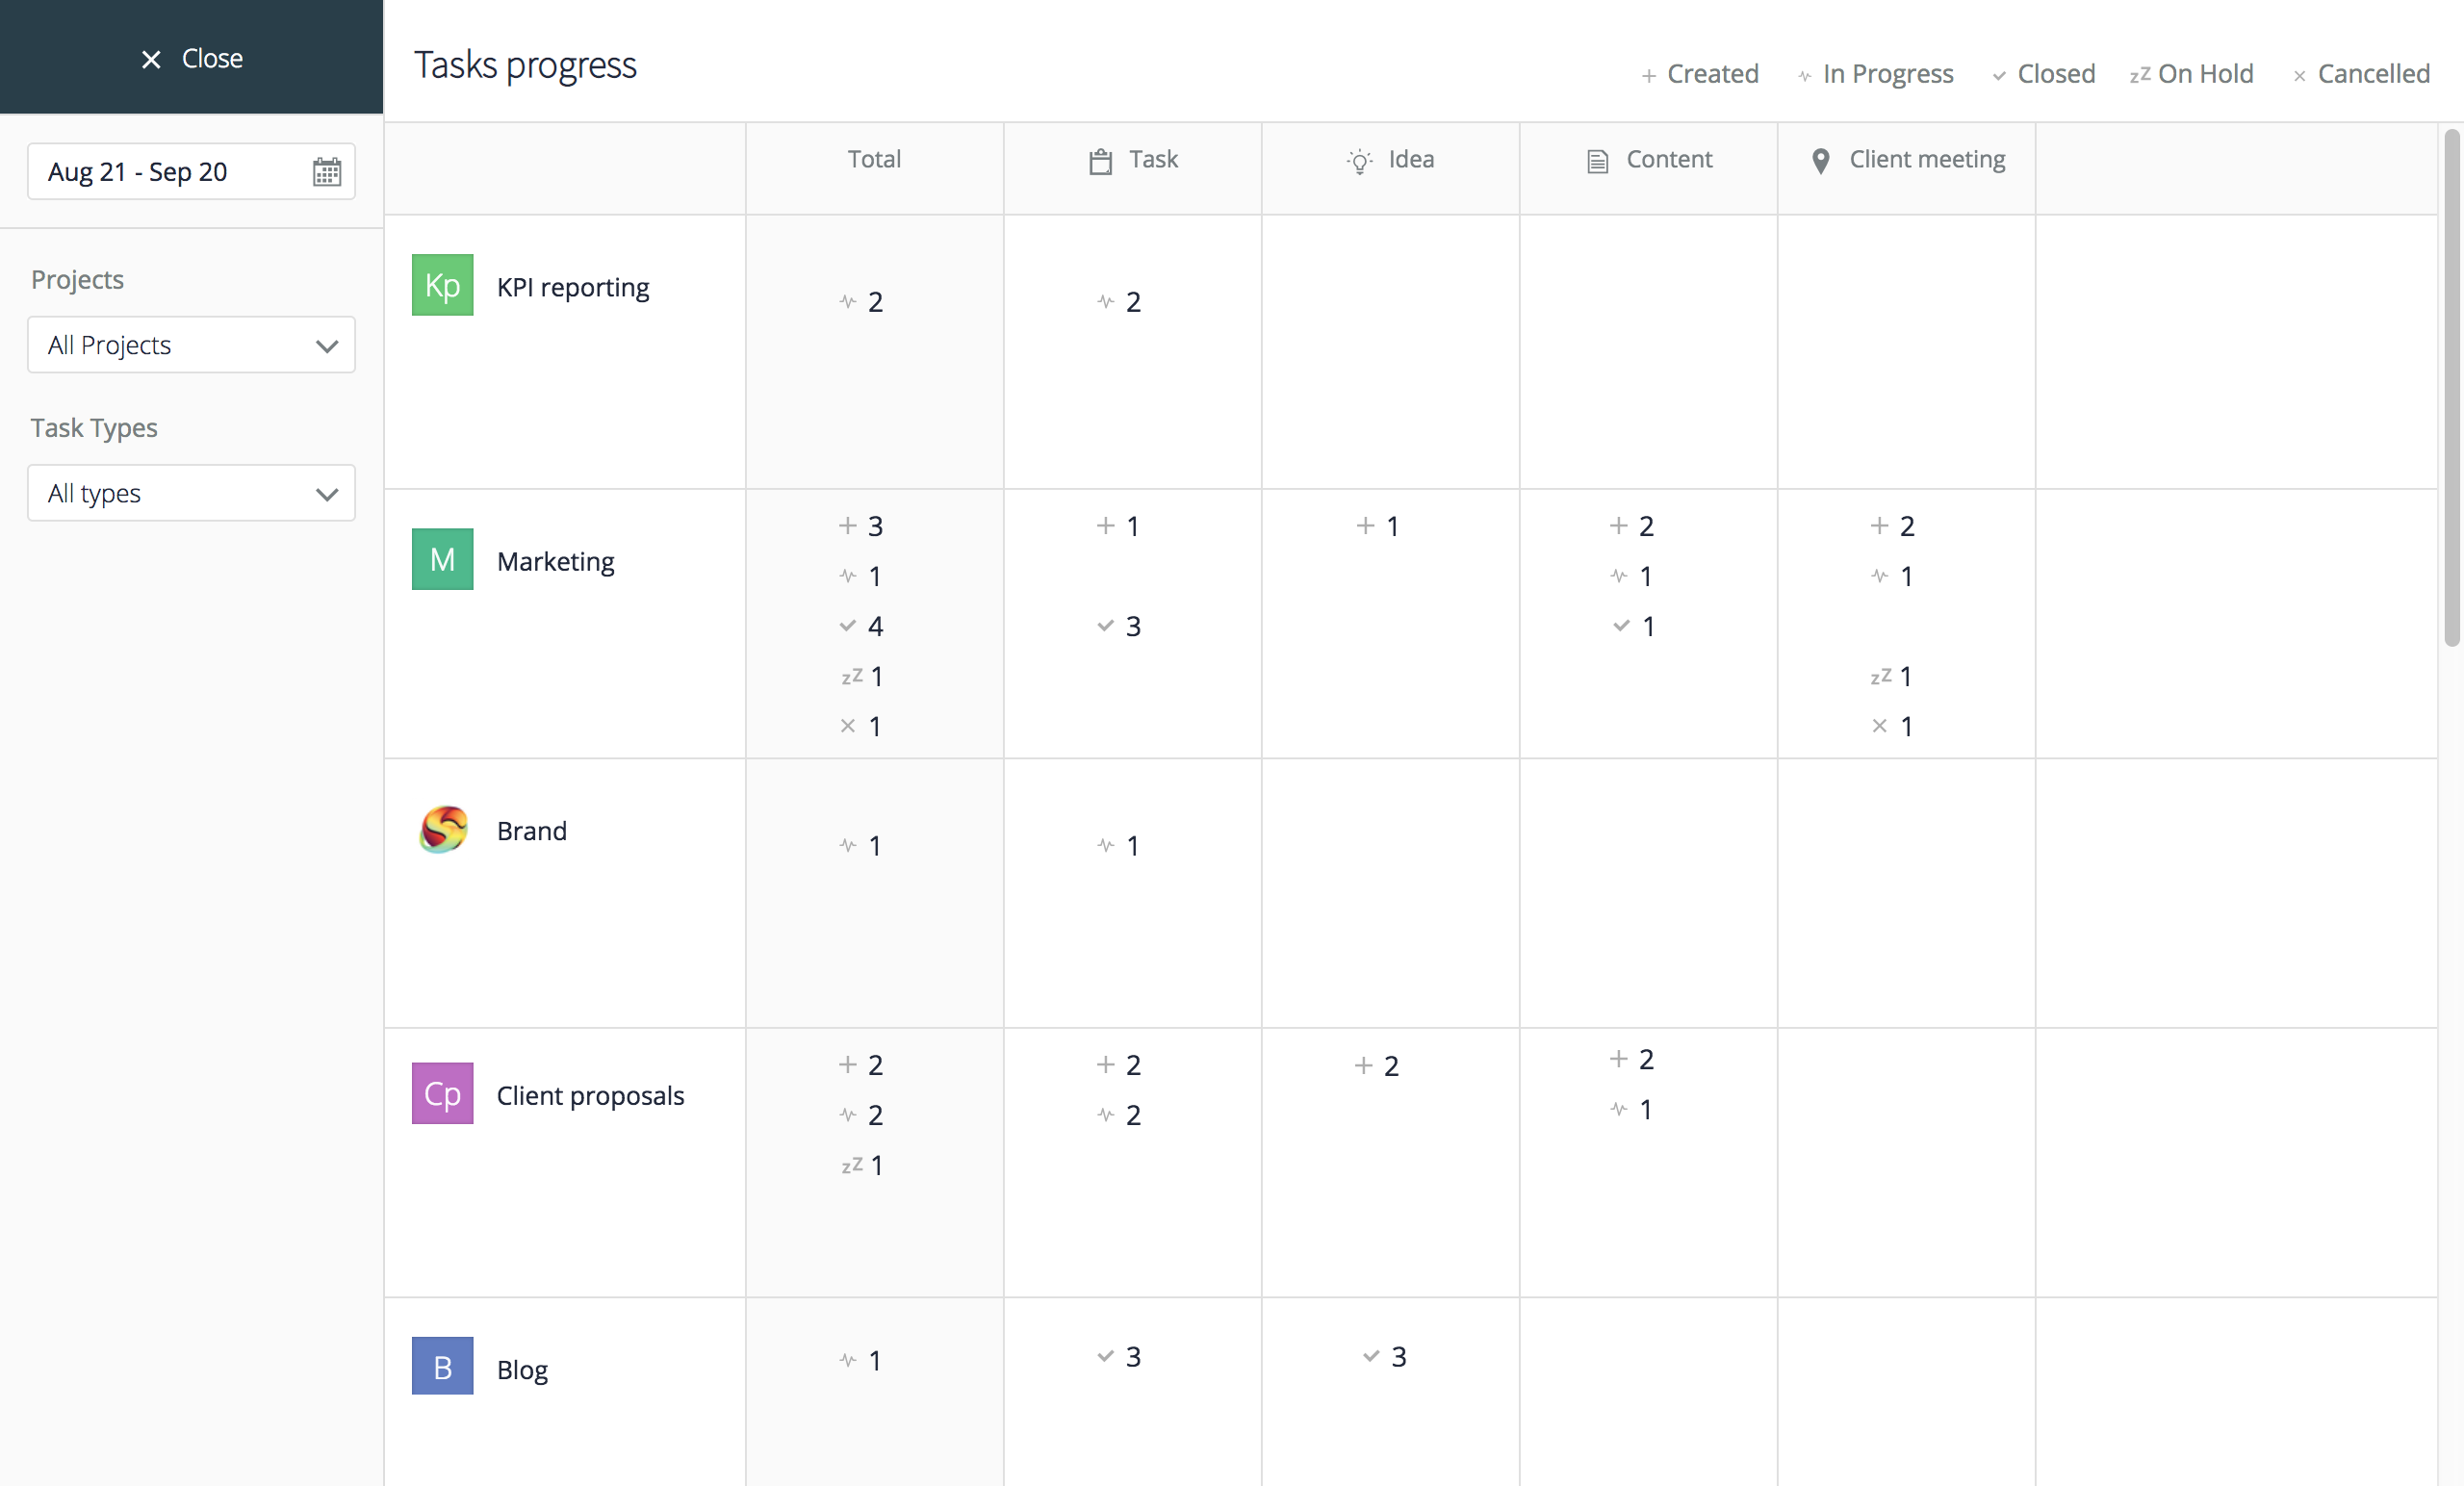
With this report, you can easily review progress for all projects at once for a specified period of time, or zero in on a particular project to see how many tasks were created, closed, put on hold, cancelled or are still in progress. The menu on the left allows choosing your reporting time period, project, and even task types you’d like to focus on.
Tasks by Project
Tasks by Project represents a high-level project activity dashboard for your organization. Here, each project is visualized as a tile with the number of active and Someday tasks plotted on a 1-month rolling timeline. You can easily see which projects have been in focus for the past 30 days (the number of active tasks is going down) or are gaining traction now (the number of active tasks is growing).
Tasks Summary
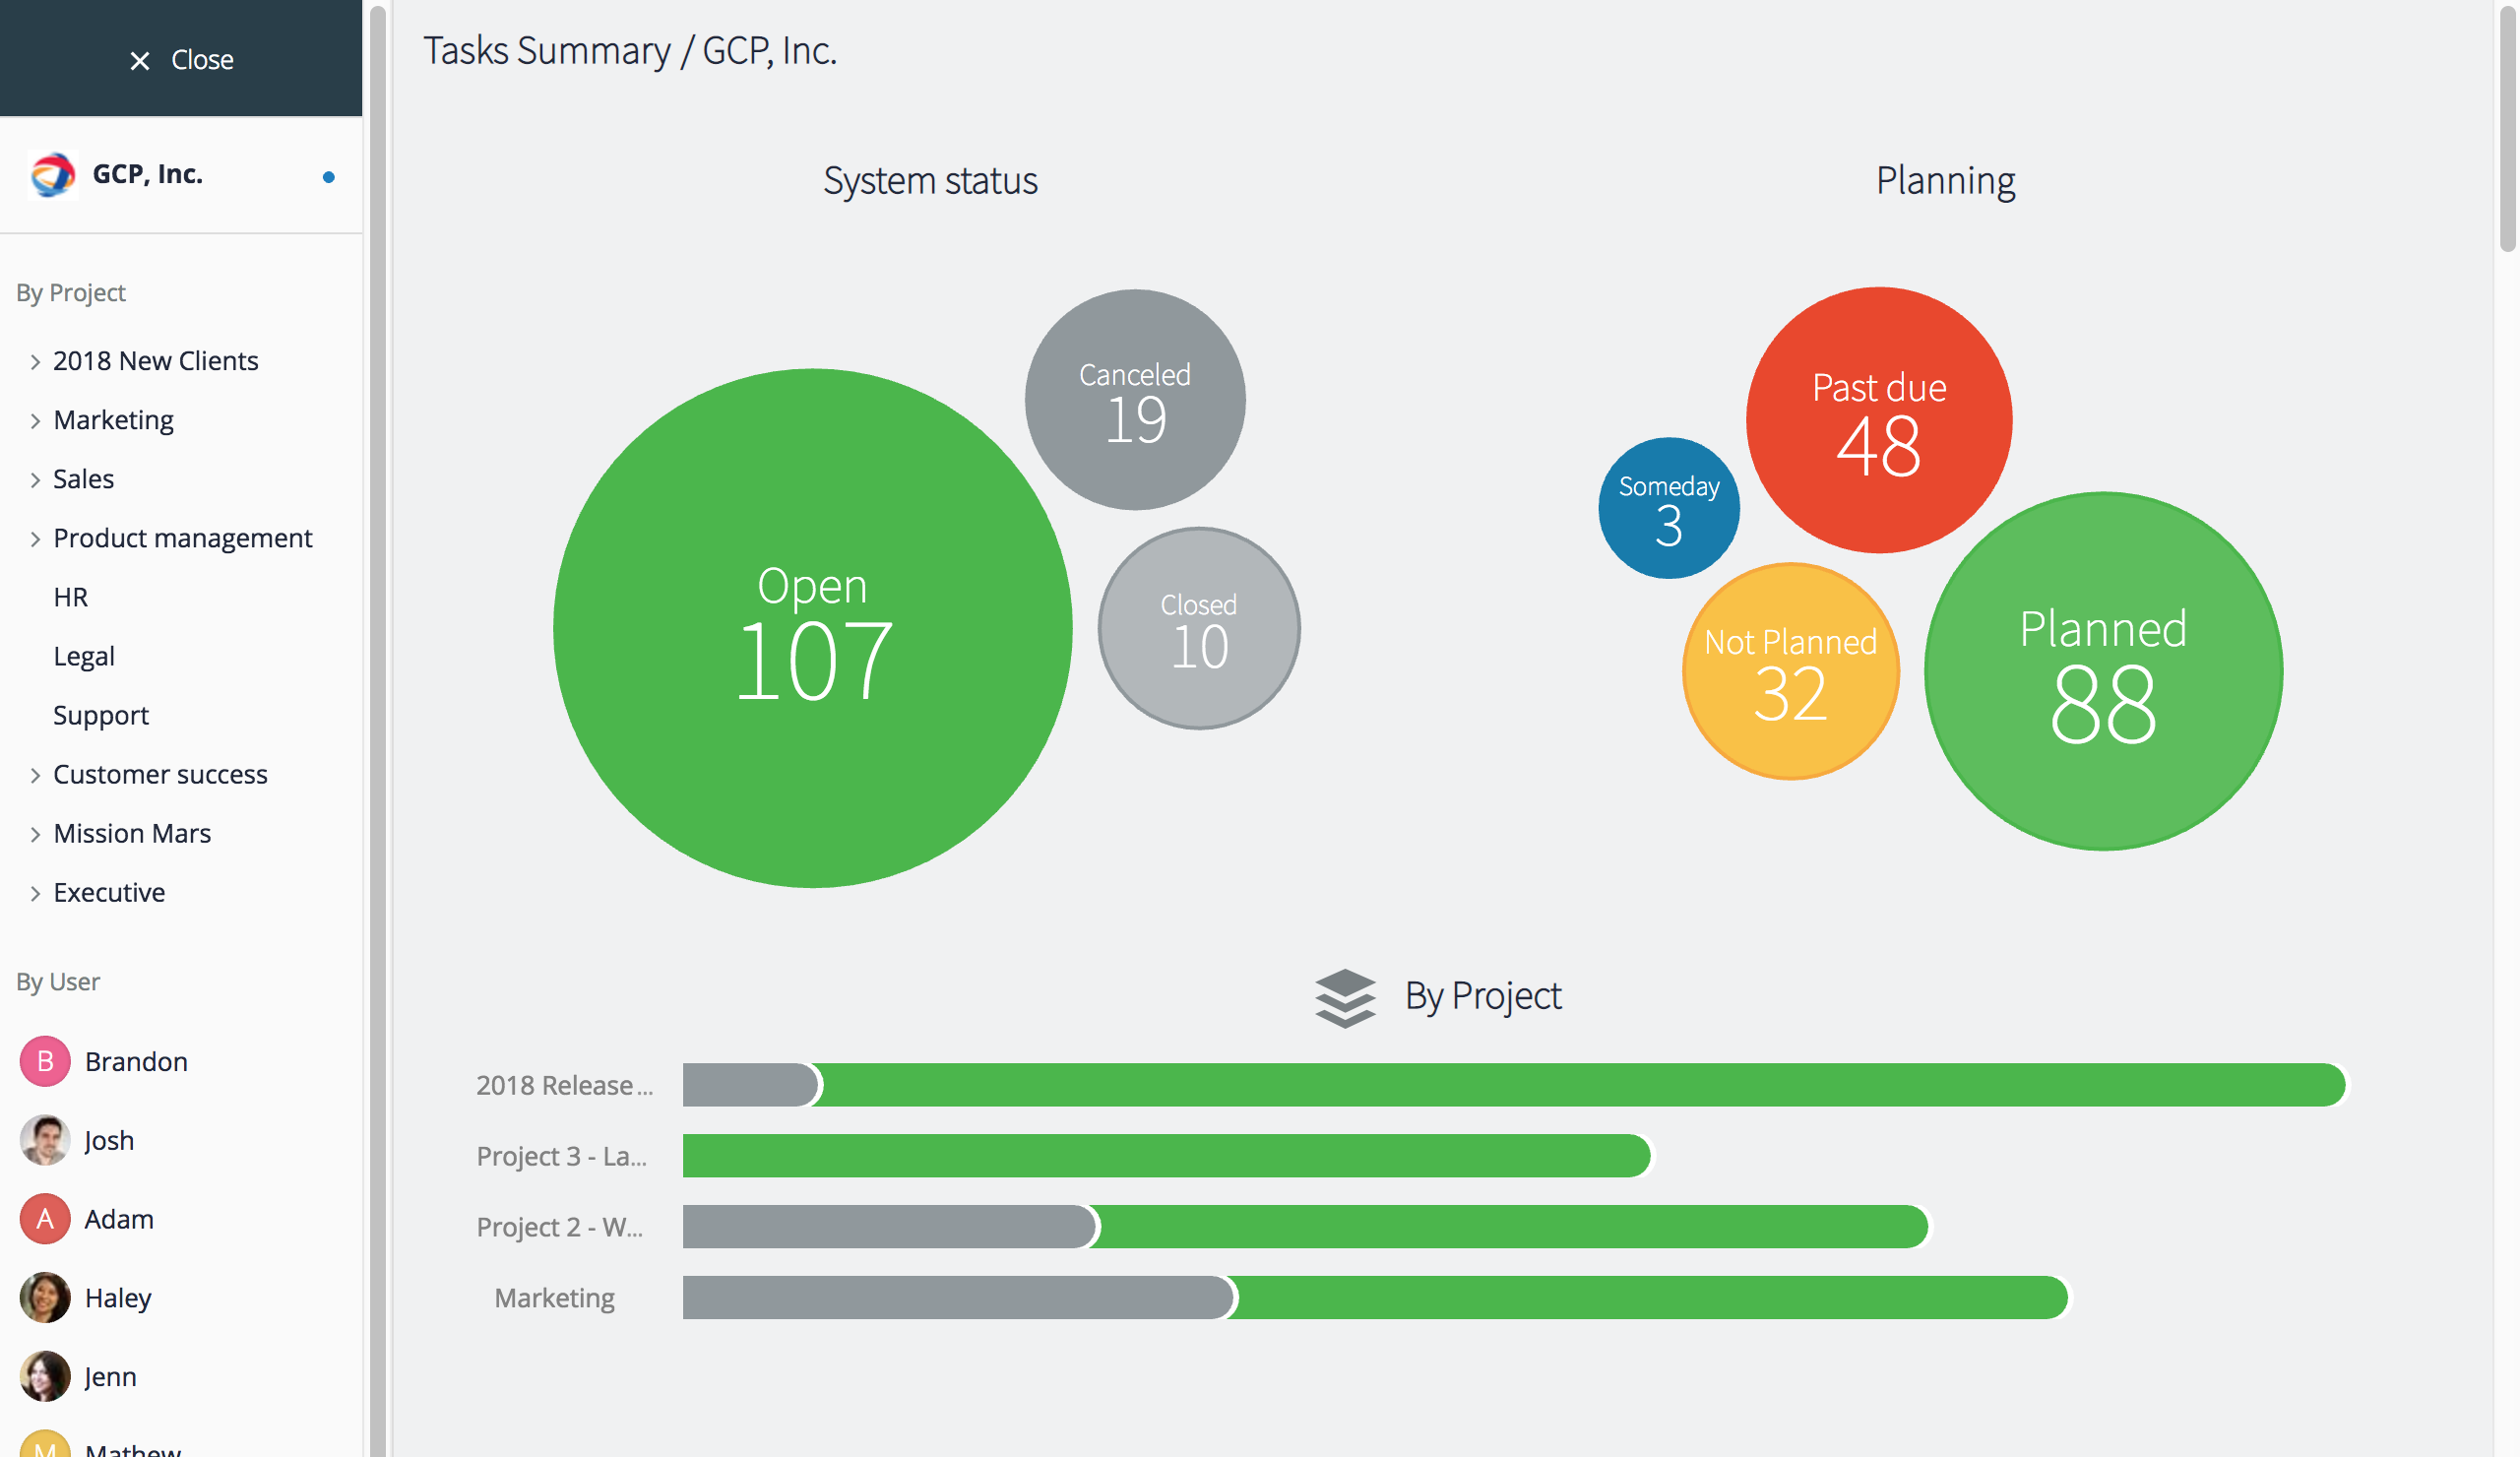
The Summary provides insight into task activity and collaboration on projects across the entire organization or by project or user. You can see the overall number of tasks by their current status, how many are past due, scheduled for Someday, or not yet planned. These details are also automatically presented by project.
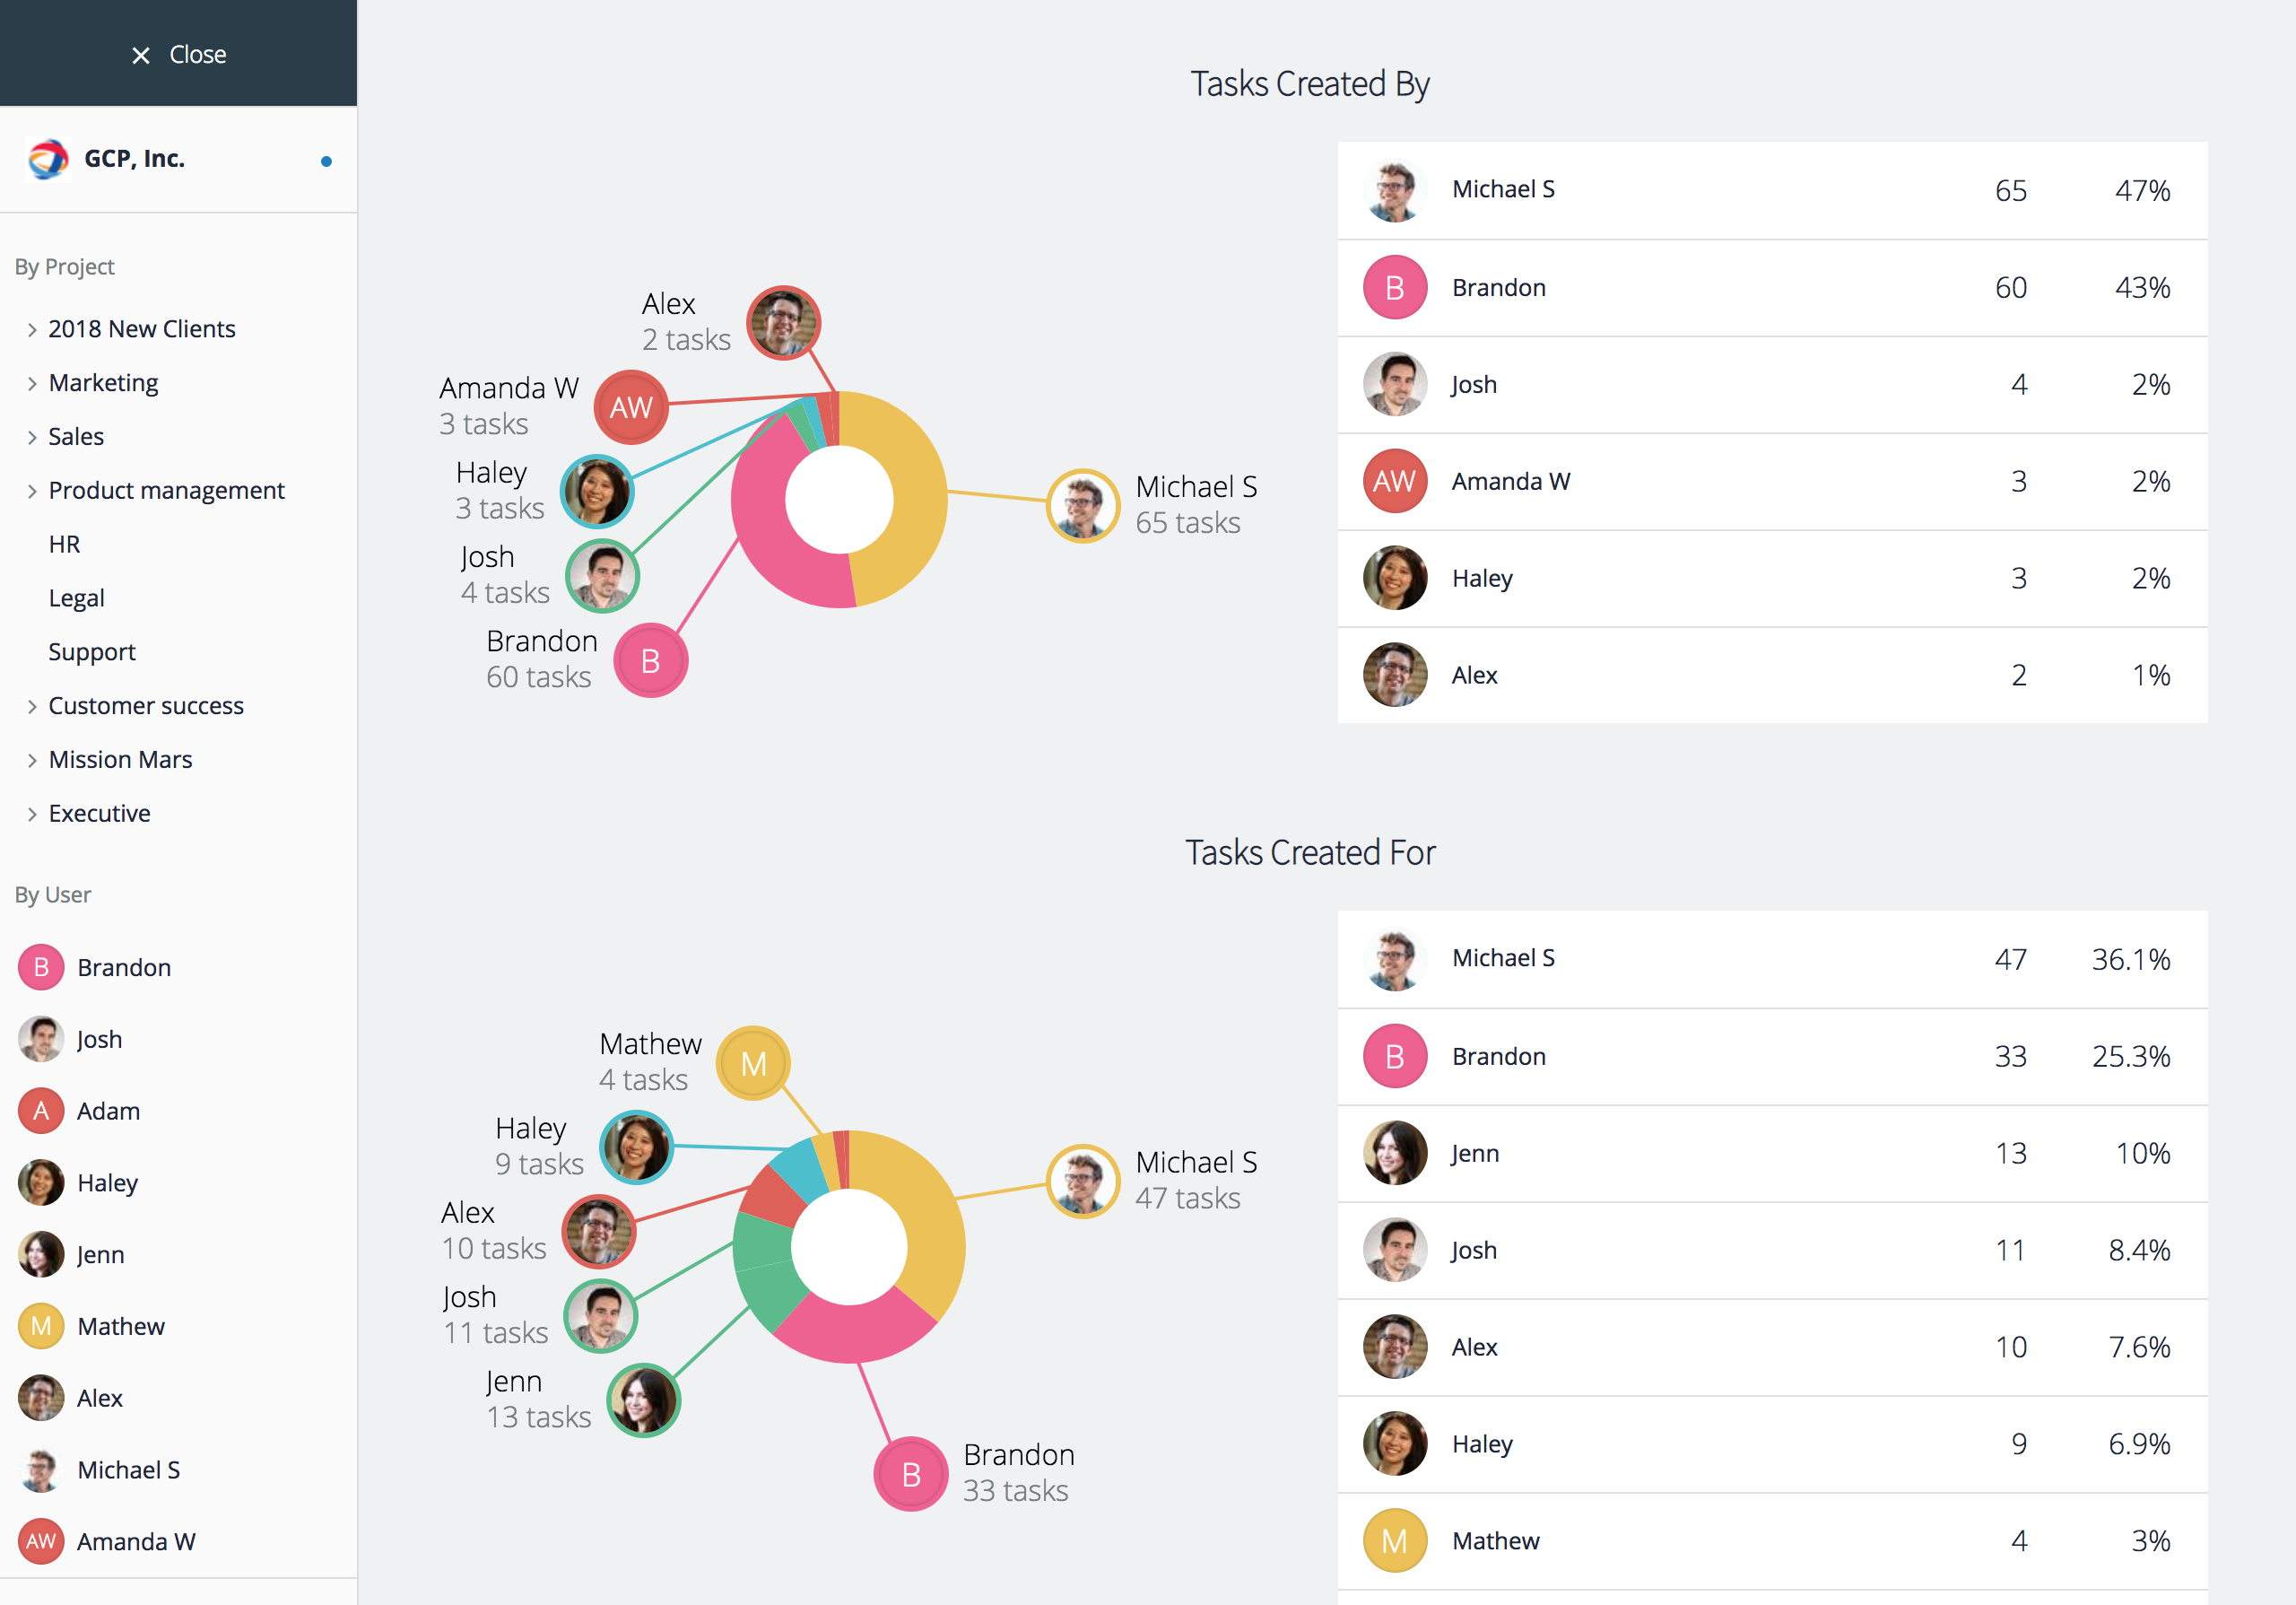
To understand the high-level collaboration patterns (either for all projects or for a specific project), review Tasks From and Created Tasks To summaries, where you can see the overall number of tasks that each user created for others. If you pick a specific user from the menu on the left, their Tasks, By Project, By Task Type, and Project Involvement charts will show their stats only, and Tasks From and Created Tasks To charts will now have the specified user listed first.