When managing a project, the right visual tool can make all the difference.
Gantt charts and timelines each serve distinct purposes. Gantt charts provide detailed insight into tasks, durations, and dependencies. And timelines offer a high-level overview of project phases.
- Detail level: Gantt charts show specific tasks, durations, and dependencies, whereas timelines show a high-level overview of project phases.
- Dependencies: Gantt charts clearly display how one task affects another, which is a core feature not usually found in simple timelines.
- Purpose: Use Gantt charts for active management of complex projects and timelines for presenting project roadmaps to stakeholders.
- Interactivity: Gantt charts are often dynamic, allowing for easy updates as tasks change, while timelines are frequently used as static, visual summaries.
GoodDay includes both Gantt chart and timeline‑style views (such as Calendar and Workload views) as part of the project management feature set. In this guide, we’ll explore all the differences between Gantt charts and timelines so you can decide which one best fits your project.
What is a Gantt chart and timeline?
A Gantt chart is a dynamic, horizontal bar chart used in project management to visualize the entire project schedule, including task durations, dependencies, milestones, and start/end dates. A timeline is a simpler, linear, or graphical representation of key events, milestones, or tasks arranged in chronological order.
What is a Gantt chart?
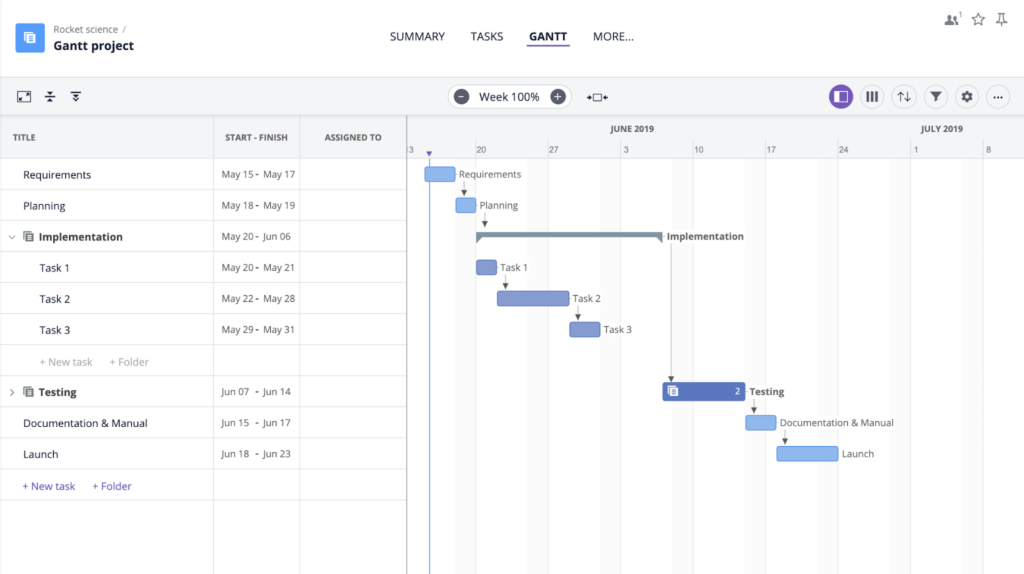
A Gantt chart is a visual project management tool that uses a horizontal bar chart to map out tasks against a timeline. It illustrates the start/end dates of elements, task dependencies, milestones, and overall project progress, allowing managers to track schedules and resource allocation at a glance.
What is a timeline?
A timeline is a visual representation of events or tasks arranged in chronological order. It shows when activities start and finish, helping you understand the sequence of work at a glance. Timelines are typically simple and focus on key milestones rather than detailed task dependencies.
Key differences between Gantt Chart and timeline?
Gantt charts offer a detailed, task-level view of a project, showcasing dependencies, durations, and resource allocation, making them ideal for complex, active management. And timelines provide a high-level, chronological overview of major milestones and phases, best suited for simplicity and quick, strategic updates.
Gantt charts
- Purpose: Detailed scheduling, tracking progress, and managing dependencies between tasks.
- Components: Lists tasks vertically, with horizontal bars representing duration and progress.
- Use Case: Complex projects with multiple, interlinked tasks and teams.
Project management timelines
- Purpose: A high-level, linear overview of key milestones or events.
- Components: Simple, chronological display of events (often on a single line).
- Use Case: Simple projects, project roadmaps, or for providing a quick summary to stakeholders.
When to use Gantt chart vs timeline
You can use a Gantt chart for complex projects requiring task dependencies, resource management, and detailed scheduling. And a timeline is better for high-level summaries, key milestones, and straightforward chronological planning.
- Use a Gantt chart: When managing tasks with dependencies, tracking daily progress, and needing a detailed view of project scope (e.g., software development, construction).
- Use a timeline: When presenting a simplified roadmap to stakeholders, focusing on major milestones, or outlining project phases (e.g., marketing campaigns, high-level project proposals).
Best software with Gantt charts and timelines in 2026
Top software with Gantt charts and timelines includes Goodday for all-in-one project management, GanttPRO for specialized planning, ClickUp for flexible customization, Smartsheet for spreadsheet-style project management, Wrike for collaboration, Monday.com for visual workflows, and TeamGantt for simplicity.
GoodDay
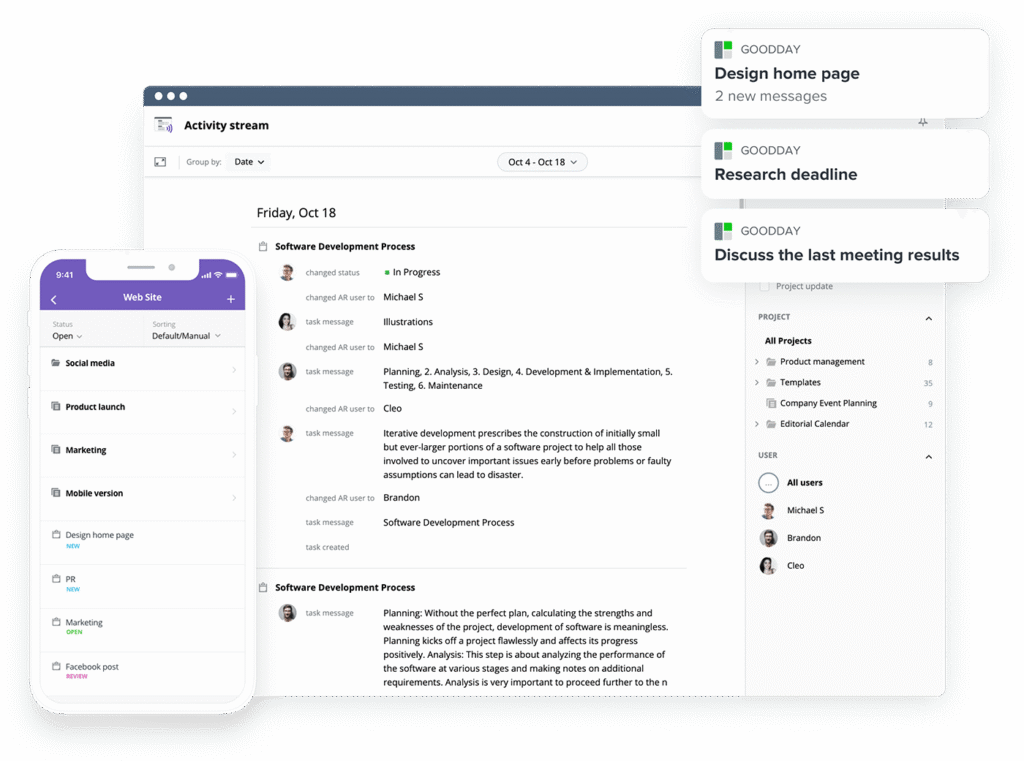
GoodDay is an all-in-one project management platform trusted by Fortune 500 companies, expanding startups, and established organizations across industries. Platform’s Gantt Charts allows teams to plan projects, allocate resources, and manage tasks, milestones, and dependencies. It supports customizable columns, auto-scheduling modes, drag-and-drop editing, and critical path visualization.
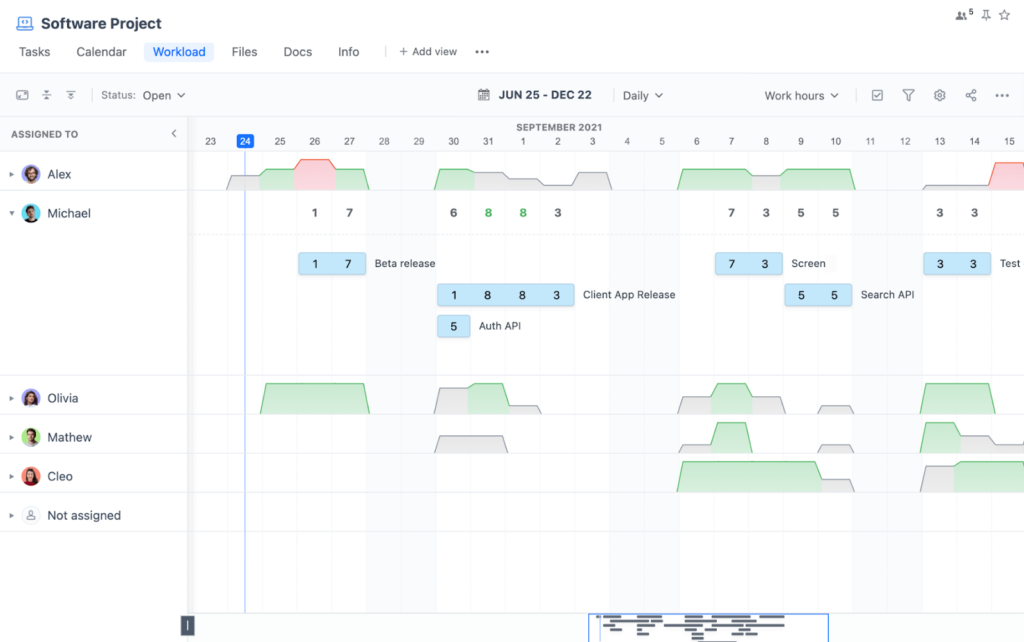
Beyond Gantt, GoodDay offers timeline-style views such as Workload and Calendar views that help visualize assignments, events, milestones, and deadlines. Workload displays task assignments with planned start and end dates on a timeline to manage resource allocation and delivery schedules.
GanttPRO
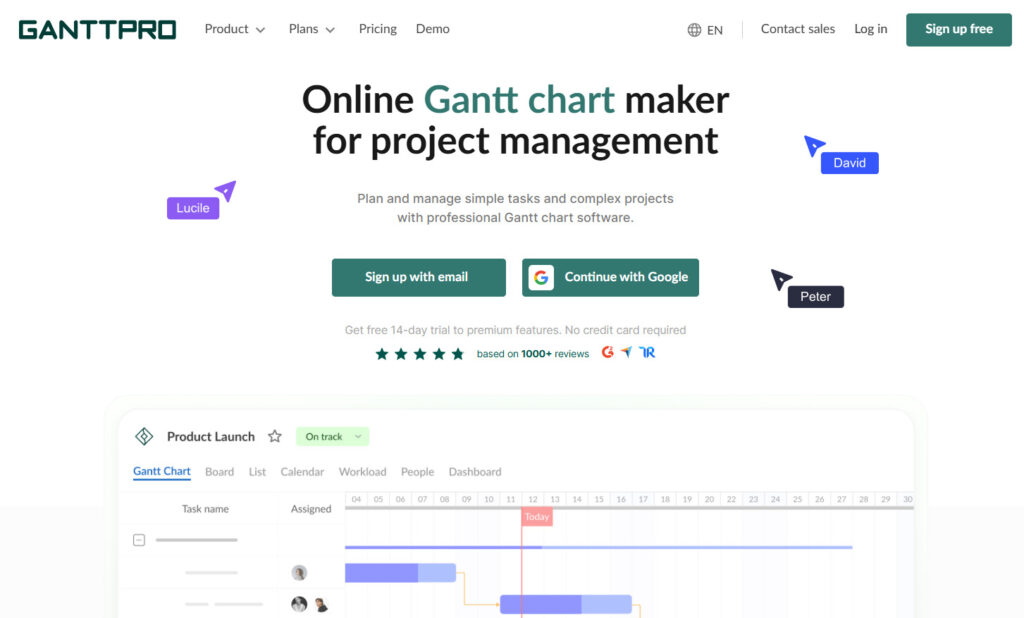
GanttPRO is centered on Gantt chart planning that enables teams to plan projects of any size, manage tasks and dependencies, and organize milestones within a timeline. The platform is designed to provide a structured scheduling environment with visual planning capabilities.
Because the chart itself visualizes durations, statuses, and dependencies, it functions as the primary timeline for projects. Interactive diagrams can also be shared through links so teams can review schedules without full access to the workspace.
ClickUp
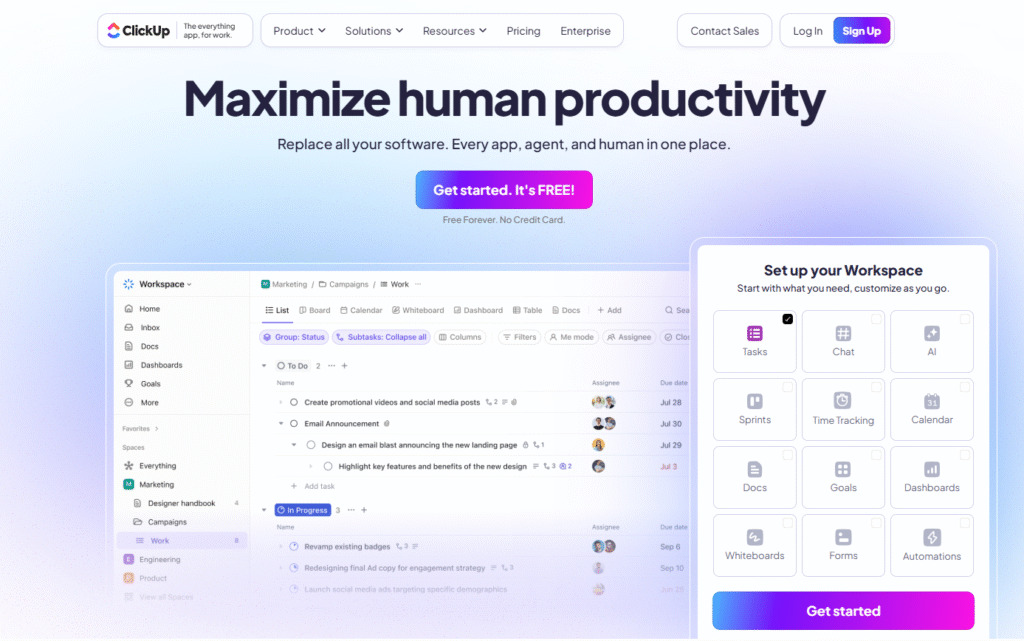
ClickUp’s Gantt Chart view turns projects into organized timelines, showing progress, dependencies, and deadlines while automatically propagating timeline changes. Teams can drag tasks, add dependencies, and activate critical path features to identify blockers and reschedule work efficiently.
The platform also provides a dedicated Timeline view that presents tasks in a linear format according to timezone preferences. Tasks appear on a canvas over time and can be grouped by attributes such as status, assignee, priority, tags, or custom fields for clearer scheduling.
Smartsheet
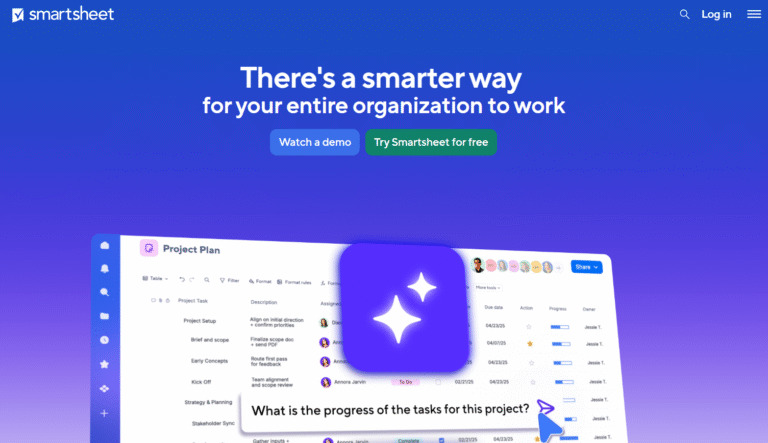
Smartsheet’s Gantt chart software transforms task lists into visual workflows that track progress, dependencies, and the critical path in real time. Drag-and-drop editing and automatic dependency updates help teams adjust timelines quickly while keeping projects on schedule.
In addition, Smartsheet provides a Timeline view where teams can visualize work sequences, create roadmaps, and manage portfolios on a horizontal timeline. The view helps highlight milestones, group items logically, and zoom to adjust the level of detail.
Wrike
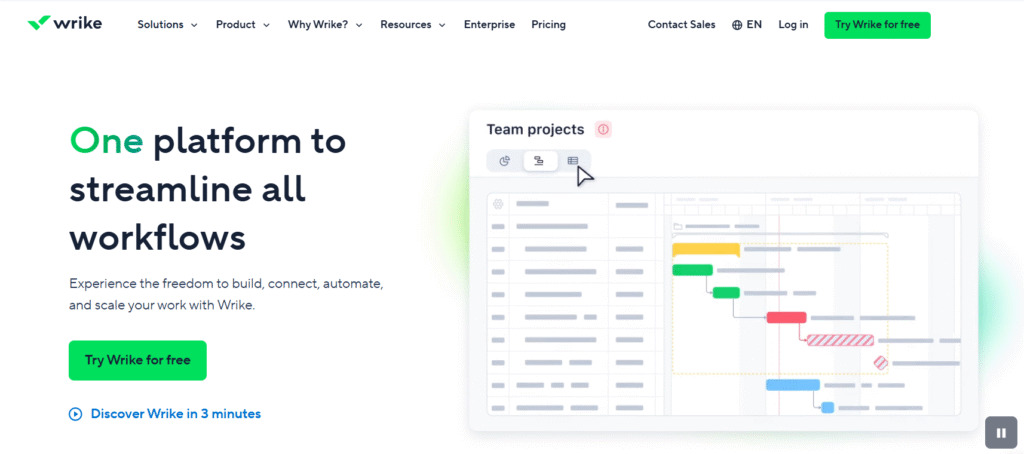
Wrike’s Gantt chart feature helps teams visualize the planning process, create dependencies, and adjust schedules by dragging dates directly on the timeline. This view provides an overview of upcoming work while showing task relationships for better coordination.
In Wrike, the Gantt chart itself acts as a timeline-based project management workspace that maps tasks, durations, milestones, and dependencies so teams share a clear schedule. Modern implementations turn this timeline into a live environment rather than a static plan.
Monday.com
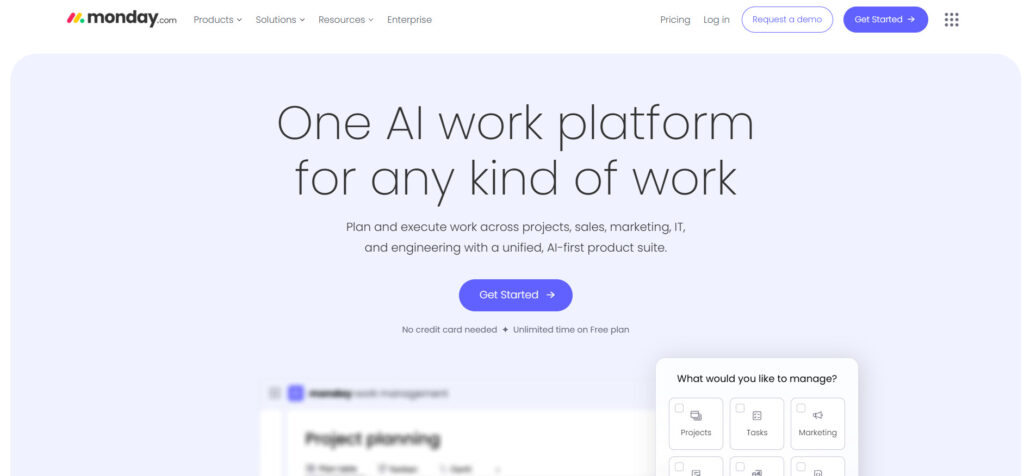
Monday.com supports visual Gantt charts that help teams plan, manage, and track projects.. These charts visualize work progress against a schedule and make it easier to track milestones, deadlines, and dependencies.
The platform also offers timeline-based planning approaches through its work management environment, allowing teams to set tasks with start and end dates and organize schedules visually within project boards.
TeamGantt
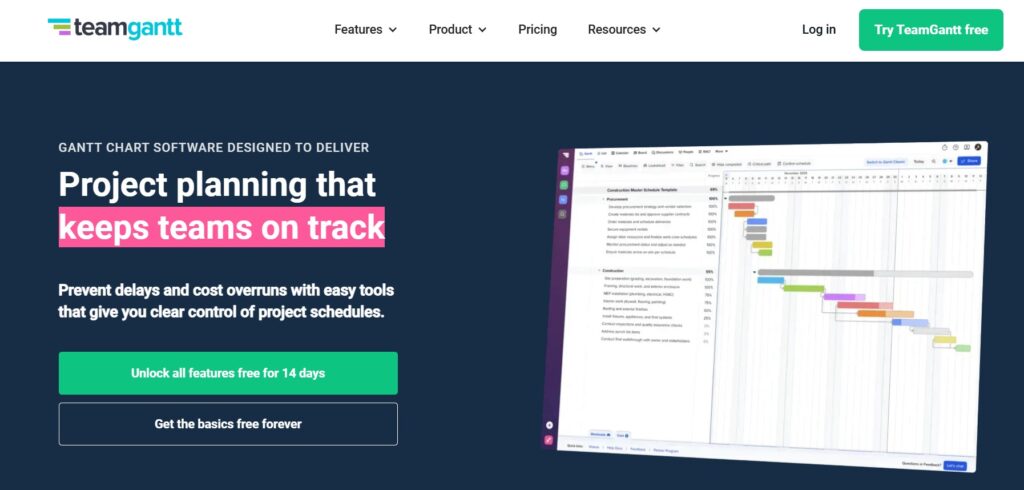
TeamGantt is built around collaborative project planning features that make it easy to schedule tasks, manage dependencies, and track progress visually on a Gantt timeline. The interface focuses on simplicity so teams can organize projects quickly without heavy setup.
Because the Gantt chart is the platform’s core planning view, it doubles as the primary timeline for coordinating schedules and task relationships.
GoodDay – robust work management software with customizable Gantt and timeline views
GoodDay is one of the most popular work management platforms globally for its powerful Gantt charts and other timeline‑style views. In 2026, it is recognized as a top-rated software in 12 Capterra shortlists.
The platform includes ready-to-use templates for teams, supports multiple project management methodologies, provides unlimited project hierarchy, built-in time tracking, CRM capabilities, and advanced security.
You can try GoodDay for free to see how it can support your projects.
And if you need help choosing the right software, you can always contact our team at info@goodday.work
FAQs
What is the difference between Gantt and timeline?
The gantt chart vs timeline comparison focuses on depth versus simplicity, as both are two project management tools designed to organize work visually. A gantt chart provides a detailed visual representation of project tasks, dependencies, and task level details, while a project timeline delivers a broad overview that highlights major milestones and significant events. In a typical chart vs timeline analysis, the chart supports progress tracking with insight into current task progress, whereas a timeline communicates sequencing at a higher level. Understanding timeline gantt chart differences helps project managers select the right tool for their workflow.
Are timelines replacements for Gantt charts?
Timelines are not replacements because the gantt chart vs timeline comparison shows each supports a different stage of managing projects. A timeline view works well for a straightforward overview or high level presentations, while a gantt chart is built for managing complex projects with dependent tasks, defined task priorities, and structured schedules. When evaluating chart vs, timelines help project teams align around critical dates, but they do not provide the operational depth needed for execution. Many organizations use both so the plan remains clear as the project evolves.
When should you use a Gantt chart?
You should use a gantt chart when managing multiple projects or coordinating multiple tasks that may overlap. It delivers a detailed breakdown of individual tasks, task durations, and critical milestones, enabling teams to track project progress with greater accuracy. This approach is particularly valuable for large projects where risk management and milestone tracking directly affect outcomes. Reviewing real gantt chart examples shows how the method strengthens project planning and improves the overall project completion rate.
When not to use a Gantt chart?
A Gantt chart may be unnecessary for smaller initiatives such as event planning, where a clear overview of project milestones is sufficient. If the tasks involved are limited and do not require monitoring completed tasks or detailed task completion, a timeline often communicates direction more efficiently. Some compact project teams prefer this approach when managing multiple projects is not required. In these situations, a timeline delivers clarity without the structure of a typical gantt chart.
What is the best tool for project management?
The best platform depends on organizational needs, but GoodDay stands out for managing projects within a scalable team structure while supporting multiple projects from a unified workspace. It combines planning, execution, and analytics so leaders maintain a clear overview of performance and ongoing project progress. GoodDay also enables strong coordination across project teams, adapting easily as priorities shift. For businesses seeking reliability and flexibility, it consistently proves to be the right tool.
What is the best software with Gantt chart view?
GoodDay is widely considered a leading choice because its advanced gantt view supports scheduling, dependencies, and real-time updates across portfolios. Teams can adopt it as free gantt chart software to begin quickly while retaining the depth required for growth. The platform’s gantt chart helps managers oversee task durations, evaluate project progress, and maintain visibility into the project completion rate. By consolidating execution and oversight, GoodDay delivers stronger progress tracking than many competing platforms.


