What is Gantt chart?
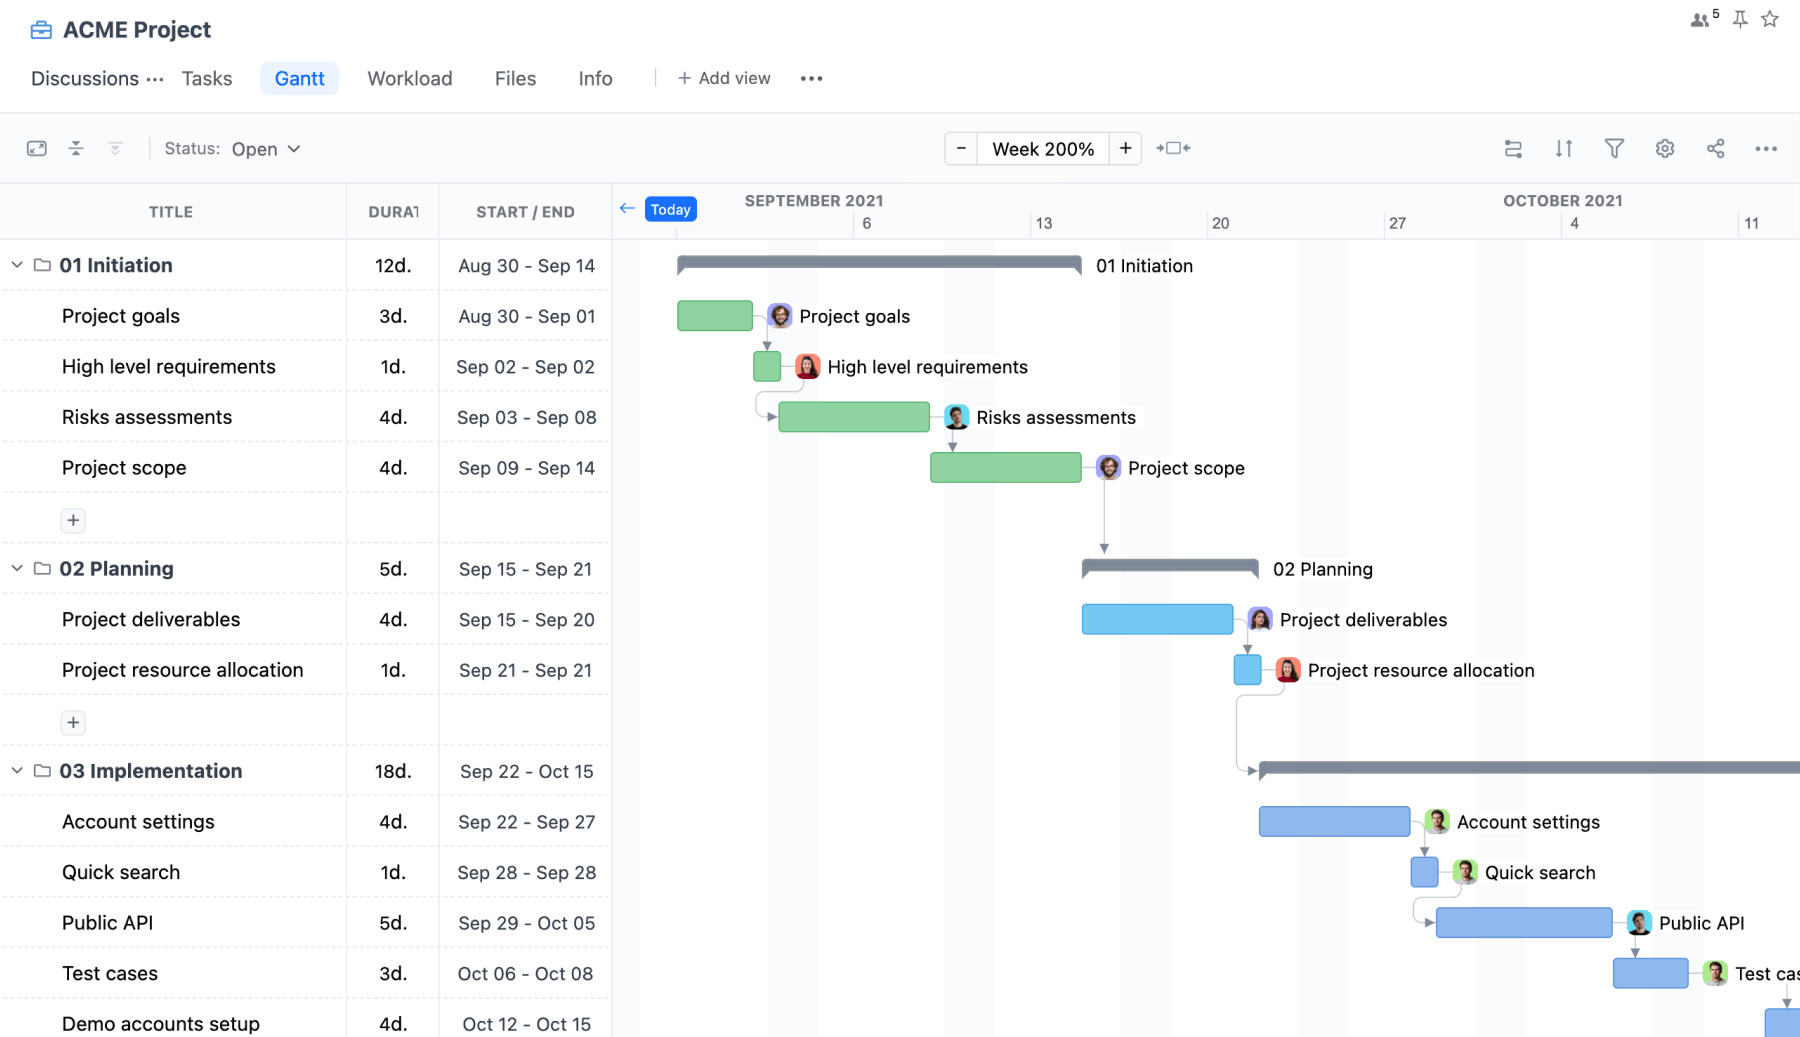
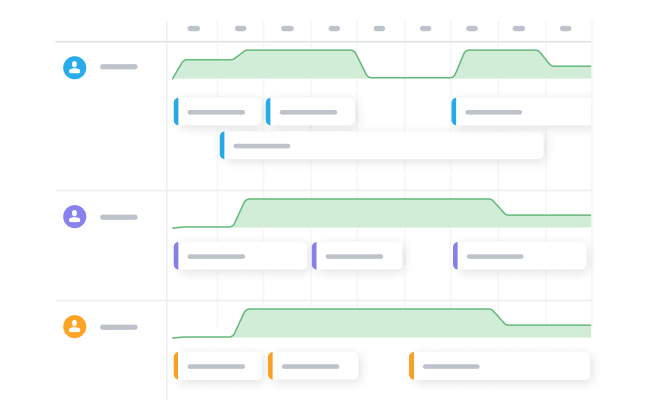
A Gantt chart is a visual representation of a project timeline that displays tasks as horizontal bars plotted against time. It was introduced by Henry Gantt and remains one of the most widely used planning formats in modern project management tools. Each bar reflects a task’s start and finish dates along a horizontal axis, while the vertical axis lists task names. In GoodDay’s Gantt chart view, project managers get a structured, real-time planning environment rather than a static chart.
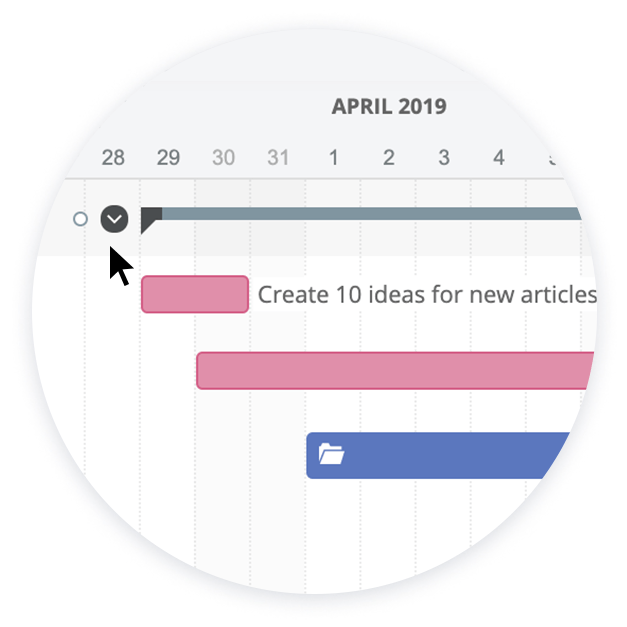
How does a Gantt chart work?
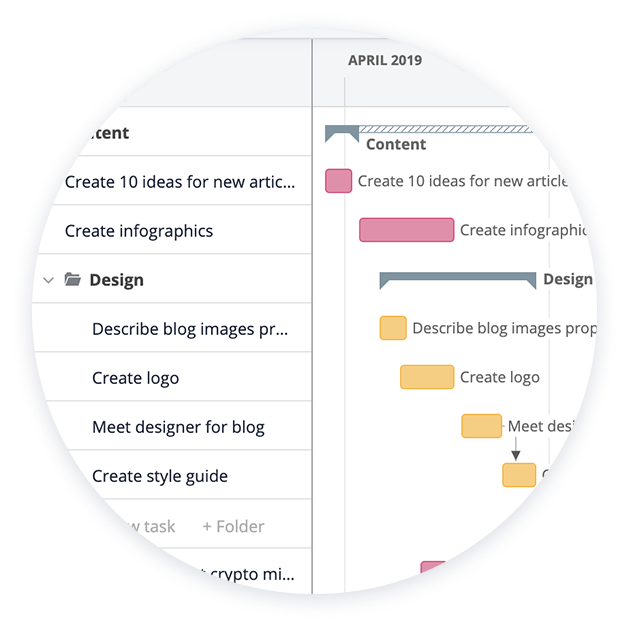
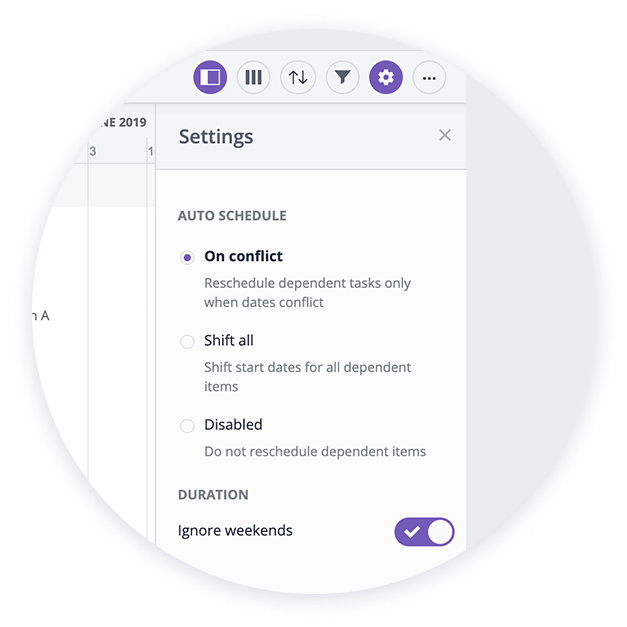
A Gantt chart works by placing tasks on a visual timeline where each Gantt bar begins at the task’s start date and extends to its end dates. The grid portion on the left side lists task information, while the right side displays individual Gantt bars aligned to the project schedule. Link lines connect dependent tasks so adjustments automatically update linked tasks. GoodDay allows users to create Gantt charts with drag-and-drop editing and automatic recalculation of dependent tasks.
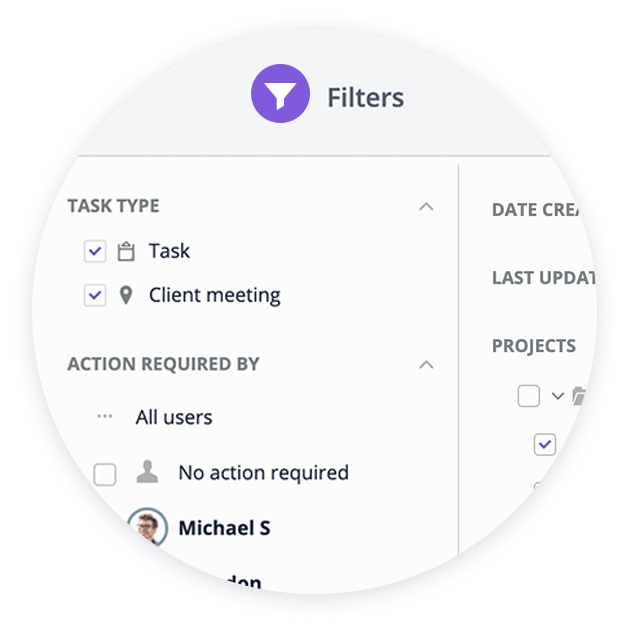
What should a Gantt chart include?
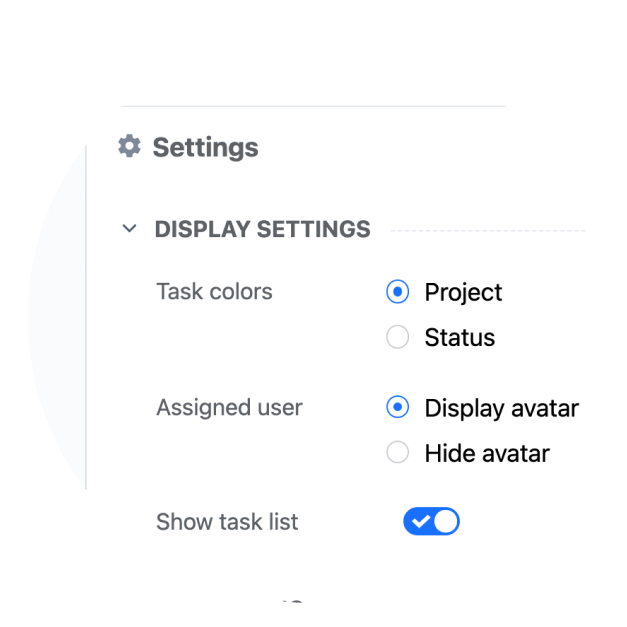
A proper Gantt chart format should include task names, start and end dates, task durations, and a clear project timeline. It should also show summary tasks and a summary task bar for grouped activities. Visual Gantt bars should clearly display task names and reflect actual start when progress begins. GoodDay includes all these elements in a comprehensive view built for complex projects.
What are dependencies in Gantt chart?
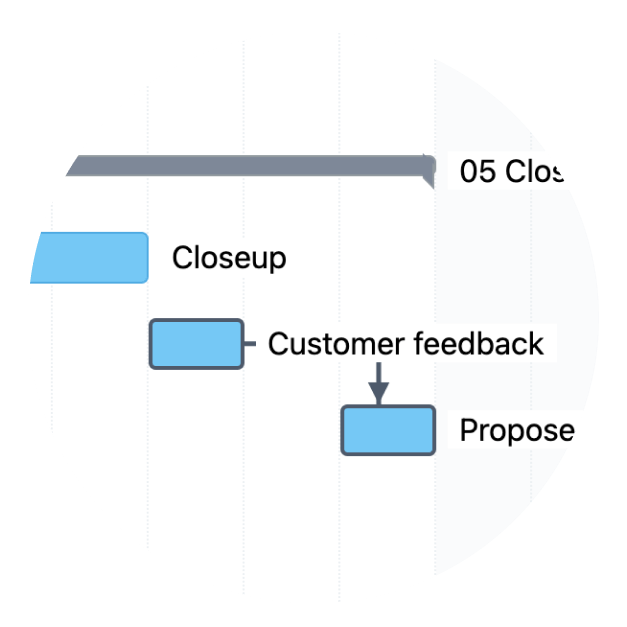
Dependencies represent relationships between tasks where one activity cannot begin or finish until another is completed. These task dependencies define how linked tasks interact across the timeline. They are visualized with link lines connecting associated Gantt bar elements. GoodDay supports all major dependency types including Finish-to-Start and Start-to-Start.
When to use a Gantt chart?
A Gantt chart is best used when planning complex projects that involve multiple team members and dependent tasks. It is especially effective for a construction project, software launches, or large events coordinated by event planners. Whenever a project requires clarity around scheduling and coordination, this format ensures tasks align correctly. GoodDay supports both small initiatives and enterprise-scale execution in the same workspace.
What to include in a Gantt chart?
You should include key deliverables, summary tasks, start and end dates, and clearly defined task dependencies. Large tasks should be broken into smaller subtasks to ensure clarity and accountability. The chart should also show critical path visibility and highlight delayed tasks when timelines shift. GoodDay allows teams to group tasks logically while maintaining accurate scheduling controls.
What is the purpose of Gantt chart in project management?
The purpose of a Gantt chart based planning system is to provide a structured visual timeline for execution. It helps project managers and team members coordinate resources, track tasks, manage task relationships, and maintain alignment across teams. By showing start and finish dates together, it ensures the project stays on track. GoodDay integrates this with real-time updates to maintain a single source of truth.
How to use Gantt chart in project management?
To use a Gantt chart effectively, define tasks, assign responsibilities to team members, and set exact start and finish dates. Then link dependent tasks so changes cascade automatically. Monitor progress against the current date using a vertical line marker. GoodDay simplifies this by centralizing scheduling, assignment, and reporting in one system.
Why is a Gantt chart useful?
Gantt chart views are helpful because they provide a high level overview of how tasks align within the bigger picture of a project. They allow team members to track progress, identify potential bottlenecks, and monitor project status against the current date. By clearly showing critical tasks and task relationships, teams can react quickly to unexpected delays. GoodDay enhances this value by combining visualization with automation in one centralized planning space.
How to show task dependencies in Gantt chart?
Task dependencies are shown by drawing connection lines between Gantt bars on the visual timeline. When one task shifts, dependent tasks automatically adjust to protect the project schedule. This prevents conflicts between start and finish dates. GoodDay enables dependency creation through drag-and-drop linking directly within the interface.
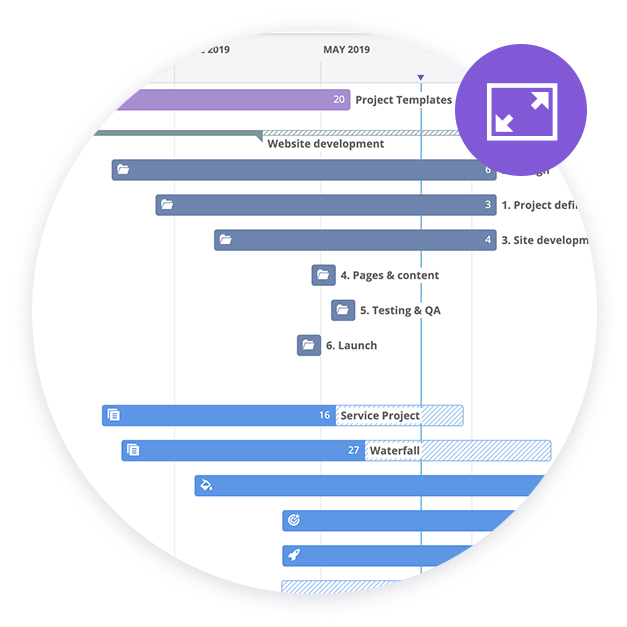
What is the best Gantt chart with dependencies?
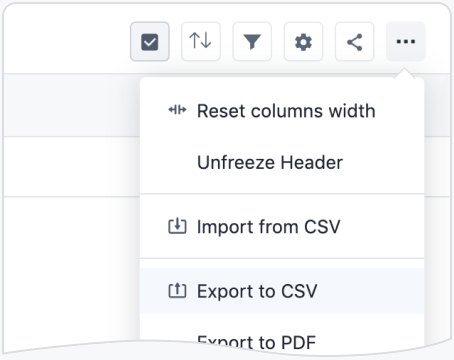
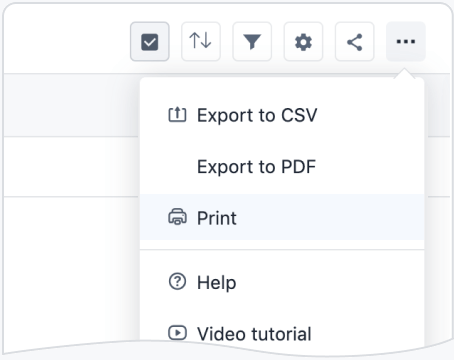
The best solution is a Gantt chart tool that combines dependency control, hierarchy management, and scheduling automation in one platform. Unlike other project management tools that separate planning from execution, GoodDay provides an integrated Gantt chart view with full dependency mapping. It supports critical path analysis, drag-and-drop editing, and export options without requiring additional software. For teams that need precision and scalability, GoodDay delivers the most complete dependency-driven planning experience.