Are you wondering what a Gantt chart is and if it is the right tool for your project?
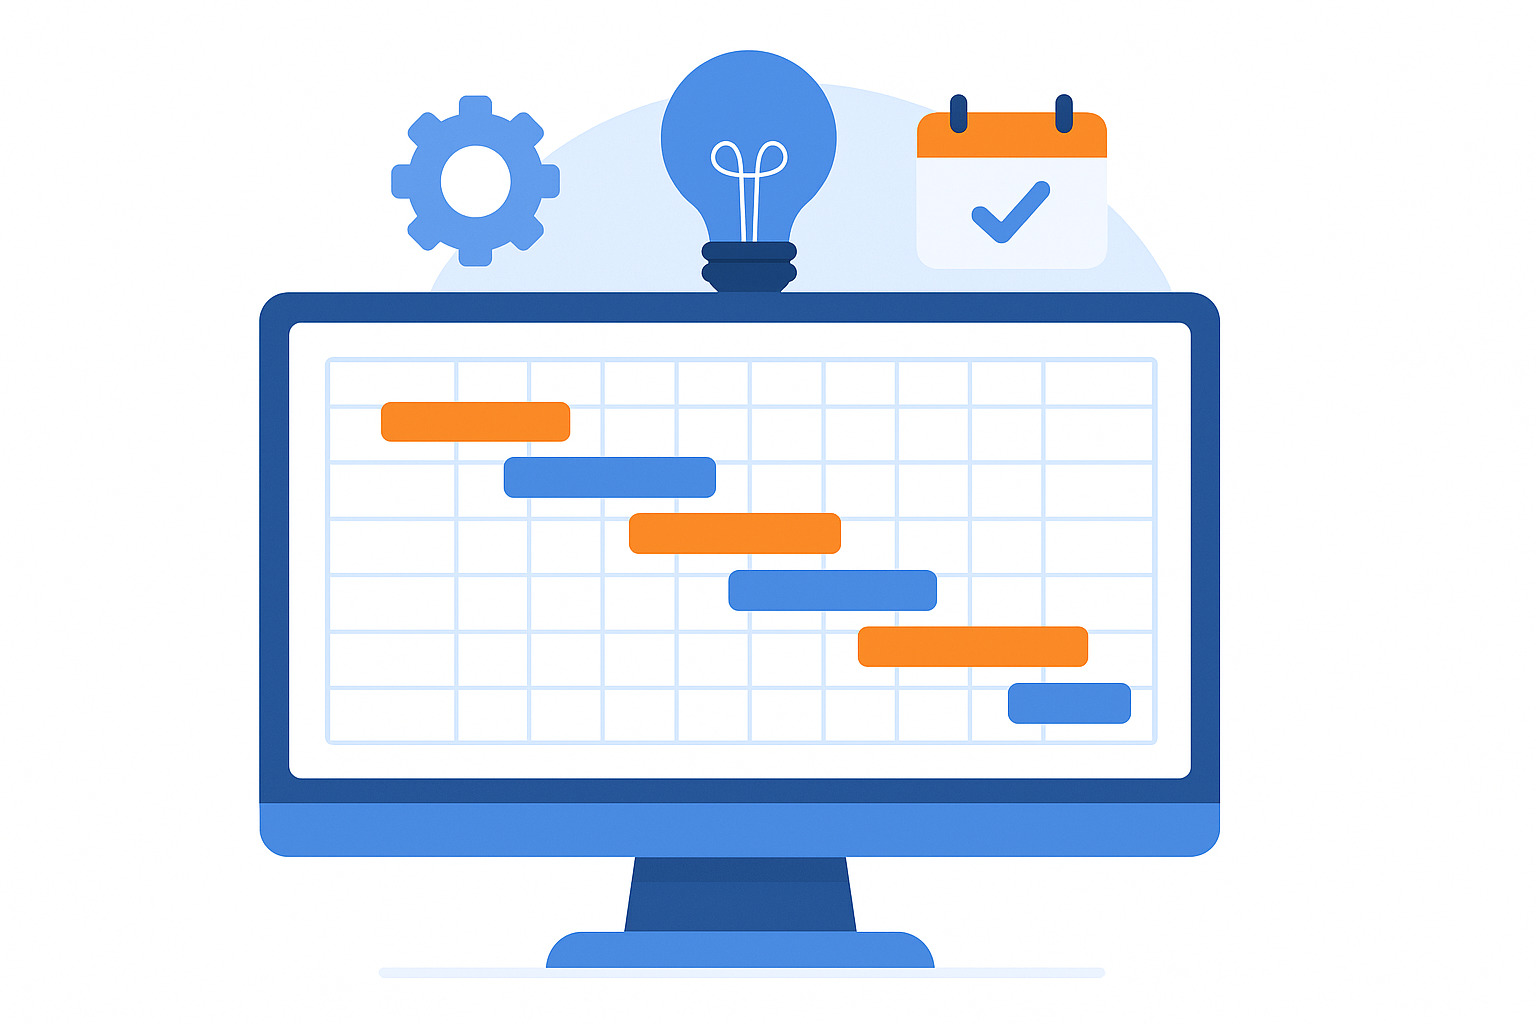
In a nutshell, a Gantt chart is a visual project planning tool that displays tasks as horizontal bars laid out across a timeline. Each bar represents a specific task, showing its start date, end date, duration, and relationship to other tasks.
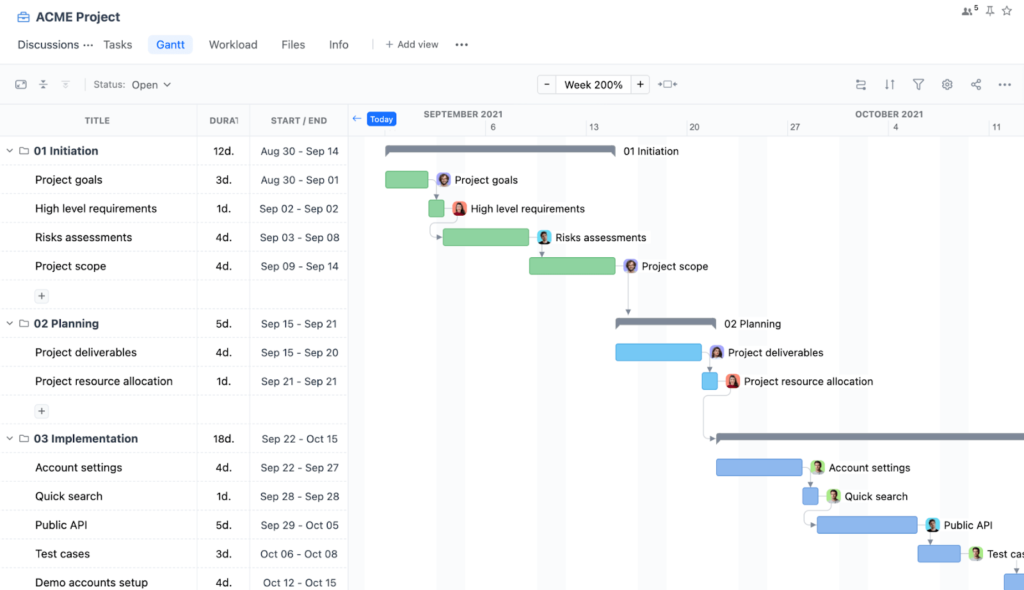
Gantt charts typically include the following components:
- Task list: A list of all the individual tasks and subtasks required to complete the project.
- Timeline: A horizontal axis representing time, showing days, weeks, or months.
- Task bars: Each task is represented by a bar, with the bar’s position and length indicating its start date, duration, and end date.
- Dependencies: Lines or arrows connecting task bars to show the relationship between tasks, such as which task must be completed before another can begin.
- Milestones: Key project checkpoints or deadlines, often marked with a diamond shape.
- Resource assignment: Assigning a specific person or team to each task to clarify responsibilities and manage workloads.
- Progress tracking: The task bars can be shaded to show the percentage of completion, providing a quick visual of how the project is progressing against the timeline.
Because the entire work plan appears on a single horizontal timeline, Gantt charts make it easier to see how work fits together and how schedule changes ripple through the project.
In this article, we’ll explore all in and outs of the Gantt chart to help you use this tool for your project. But if you have any questions that are not covered in this article, you can always connect with our team via info@goodday.work
At GoodDay, our Gantt chart software that makes managing project timelines effortless. The platform supports everything from simple workflows to complex, multi-stage workstreams, helping teams stay aligned at every step.
What is a Gantt chart: definition & history
Gantt charts are one of the most widely used tools in project management because they transform complicated plans into a simple visual that everyone can understand at a glance. They show not only what needs to be done, but also when, in what order, how long it takes, and who is doing it.
Originally created in the 1910s by Henry Gantt, these charts have become essential for planning everything from construction work and engineering projects to marketing campaigns, research timelines, and software development.
And modern Gantt chart software like GoodDay adds advanced features like resource allocation, workload monitoring, risk warnings, and real-time collaboration.
How does the Gantt chart work?
A Gantt chart works by visually mapping project tasks on a timeline, using horizontal bars to show each task’s start, duration, and end, with tasks listed vertically and time horizontally, revealing dependencies, overlaps, and progress to help manage schedules and identify bottlenecks at a glance. It breaks complex projects into manageable parts, making it easy to see who’s doing what and when, ensuring alignment and tracking progress against deadlines. A Gantt chart includes:
- Task list (vertical axis): Lists all project activities and subtasks, often with details like assignees and work breakdown structure.
- Timeline (horizontal axis): Represents days, weeks, or months, showing the project’s duration.
- Task bars: Each task is a horizontal bar; its position shows the start date, and its length shows the duration (start to finish).
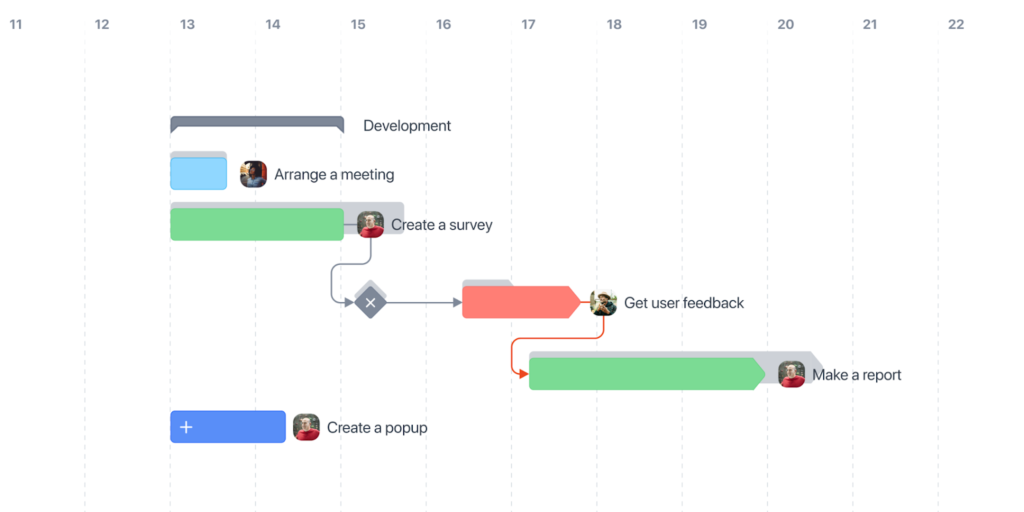
- Dependencies: Lines or arrows connect bars to show that one task must finish before another can start (e.g., Task B depends on Task A).
- Milestones: Diamonds or stars mark significant checkpoints or deadlines.
- Progress tracking: Bars can be shaded or colored to show completion percentage, letting you see actual progress vs. planned.
5 best Gantt chart software in 2026
The easiest way to create a Gantt chart is to use specialized software that handles dates, tasks, and dependencies for you. Here are some of the top Gantt chart software solutions for you to choose from.
GoodDay
GoodDay offers some of the most flexible Gantt chart views available. It includes advanced features like dependencies, workload management, custom workflows, and real-time progress tracking. The platform is recognized as a top-rated software in 12 Capterra shortlists and is trusted by Fortune 500 companies, startups and businesses of all sizes all over the world.
Smartsheet
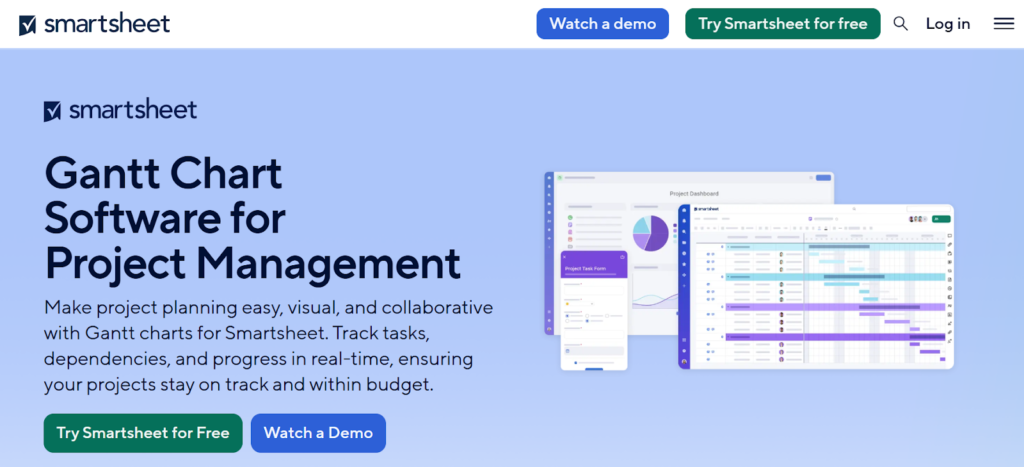
Smartsheet provides spreadsheet-style project management with a built-in Gantt chart that updates as soon as dates or dependencies change. It works well for teams that prefer a familiar grid layout but want stronger visualization than a basic spreadsheet.
TeamGantt
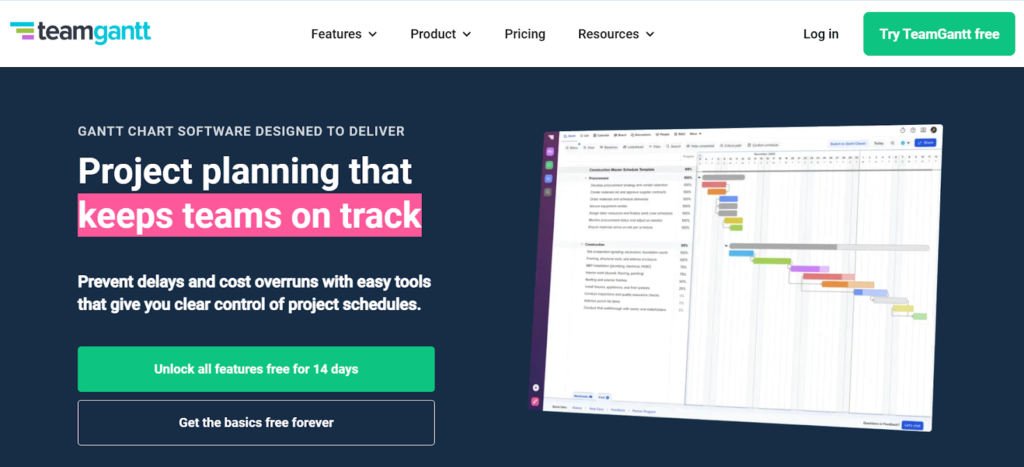
TeamGantt is especially suited for small teams or small-scale projects. It offers drag-and-drop scheduling, clean timeline views, and straightforward task tracking. Its strength is simplicity, though it may feel limited for larger teams that need advanced automation or resource management.
ClickUp
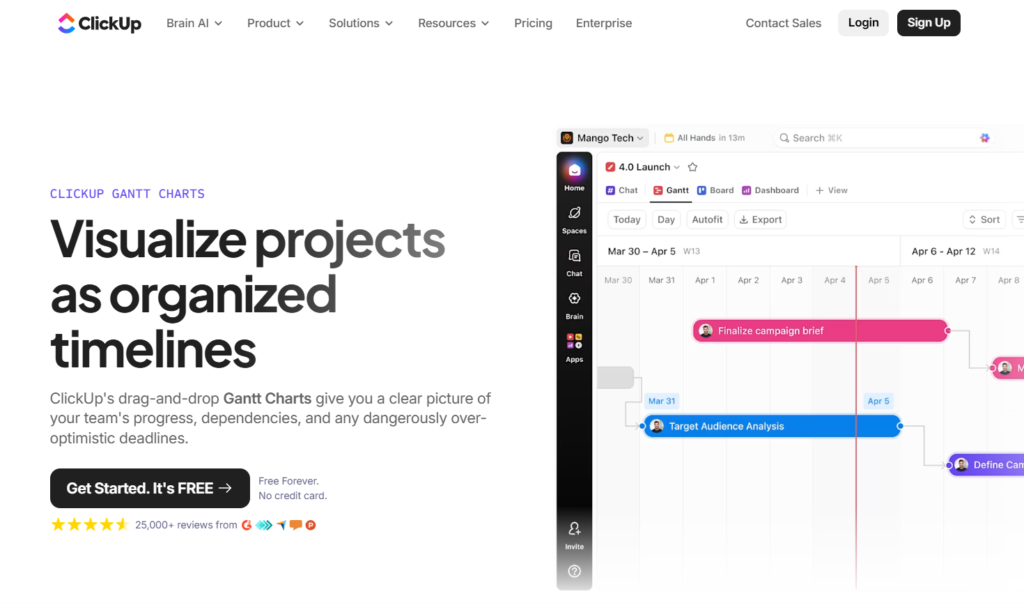
ClickUp offers Gantt charts that support dependencies, milestones, and detailed time tracking. Users can switch between multiple views while keeping the Gantt chart synced with all project updates. This is helpful when different departments prefer different layouts, for instance, developers using task lists while managers monitor project status progress in the Gantt view.
Wrike
Wrike’s Gantt charts are well-suited for collaborative work across multiple teams and projects, offering clear task dependencies, real-time collaboration, and strong reporting tools. The platform gives teams a centralized timeline that helps keep schedules aligned even when many contributors are involved.
How to create a Gantt chart in 3 simple steps

The easiest way to build a Gantt chart is to use GoodDay, which creates the timeline automatically as soon as you add tasks and dates.
Step 1: Add your project tasks and dates
Start by entering the tasks you want to complete and assign each one a start and end date. GoodDay places every task on the timeline instantly, and dependencies can be added with a single click, helping you see the correct sequence of work.
Step 2: Open the Gantt view
Once your tasks are added, switch to the Gantt view in GoodDay. The system generates a ready-to-use timeline with bars representing task duration. You do not need to build a template or format anything manually, GoodDay keeps the timeline accurate as your project evolves.
Step 3: Add milestones and link dependencies
Mark key deadlines as milestones and connect related tasks to show how one step flows into the next. GoodDay automatically adjusts the chart when dates change, making it easy to keep the plan current and avoid scheduling conflicts.
What is a Gantt chart used for?
Gantt chart in GoodDay
A Gantt chart helps teams plan, organize, and monitor project work by showing tasks, timelines, and responsibilities on a single visual timeline.
Project planning
Teams use a Gantt chart to break a project into clear tasks, assign timeframes, and organize work from start to finish. This makes it easier to understand the full scope, estimate timelines, and set a realistic plan before execution begins.
Timeline visualization
Gantt charts provide a simple visual timeline that shows task order, key milestones, and overall duration. This helps teams and stakeholders understand the project flow without needing detailed explanations.
Tracking progress
By updating task statuses directly in the chart, managers can see whether work is on schedule or falling behind. This visibility helps teams correct issues early and stay aligned with the project timeline.
Workload balancing
Many teams use Gantt charts to check whether workloads are evenly distributed across team members. Seeing workloads in context helps managers adjust assignments before delays occur.
Cross-team coordination
When multiple teams contribute to one project, a Gantt chart shows how their work aligns across the timeline. This reduces communication gaps and helps teams coordinate shared deadlines.
Resource allocation
A Gantt chart shows when specific people or resources are needed, helping managers avoid overloads or conflicts. With a clear view of who is working on what, teams can distribute work more evenly and prevent bottlenecks.
Dependency management
Gantt charts show how tasks relate to each other, including which tasks must finish before others begin. This helps managers identify the critical path, plan parallel work, and maintain a smooth sequence of activities.
Stakeholder reporting
Gantt charts are often used in status meetings because they give a clear snapshot of completed work, current progress, and upcoming tasks. Stakeholders can quickly understand risks, delays, or changes in the schedule.
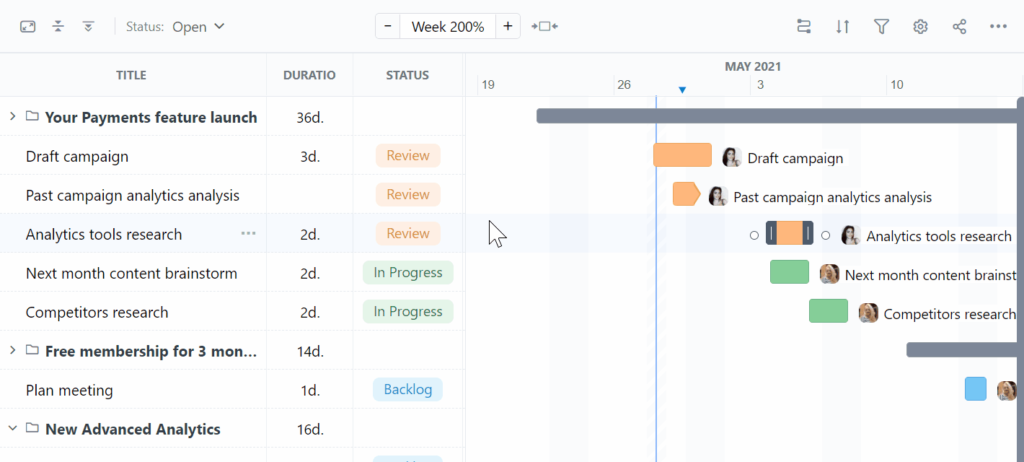
Gantt chart example
Gantt chart in GoodDay
With a Gantt chart, a project moves from initial planning to final completion on a single organized timeline. Tasks appear as horizontal bars, allowing you to see their duration, order, and overlap at a glance. Early planning activities are placed at the beginning of the timeline, while later execution and wrap-up tasks appear toward the end, creating a clear flow of work.
GoodDay automatically positions tasks based on their start and end dates, and dependencies can be added with one click to show how tasks relate to each other. Milestones stand out as key checkpoints that help teams understand major transitions or deadlines.
As work progresses, GoodDay updates task bars in real time, making it easy to track whether the project is moving as planned.
Although every project has different steps, the core structure is the same: a clear sequence of tasks, time-based visualization, visible dependencies, and easy progress tracking. This layout helps teams understand the project lifecycle from start to finish with minimal effort.
Create your Gantt chart in minutes
If you want to plan your projects with less effort and more visibility, you can make your Gantt chart with GoodDay.
The platform gives some of the strongest combinations of customization and affordable pricing.
And if you have any questions about making a Gantt chart, you can always connect with our team at info@goodday.work
FAQs
What is a Gantt chart?
A Gantt chart is a visual representation of a project plan that displays tasks as a horizontal bar chart along a timeline. It is widely used in project management because it helps project managers organize work and understand the project’s duration at a glance. The Gantt chart format includes task descriptions, start and end dates, and task durations that show how work fits together. Originating from Henry Gantt, this method allows teams to monitor progress and keep everyone on the same page throughout the project life cycle.
What are the 7 important elements of a Gantt chart?
A typical Gantt chart contains a vertical axis listing the task list and a horizontal axis showing the project timeline from early work to the project’s end date. Key elements include task sequence, key deliverables, project phases, and project schedule details that guide project stakeholders. Many teams assign tasks to team members and include milestones to reflect the critical tasks within the entire Gantt chart. These components help allocate resources optimally and maintain project efficiency throughout complex projects.
How does a Gantt chart work?
A Gantt chart tool displays tasks involved in a linear task sequence so that project teams understand how work flows toward the project’s completion date. Each bar shows task completion progress and helps project managers schedule tasks accurately within the defined project scope. When you use a Gantt chart, it becomes easier to integrate Gantt charts with other project management tools and maintain the project running smoothly. GoodDay simplifies this process by giving users an intuitive way to make a Gantt chart and create a visual representation of how every task, dependency, and milestone fits together across the entire project timeline.
What are Gantt chart task dependencies?
Task dependencies explain the task relationships between dependent tasks and determine the order in which complex tasks must be completed. Dependencies ensure project success by identifying the critical path and highlighting how delays may affect the entire project. They also connect work through clear task relationships, which keeps the project schedule accurate. GoodDay makes it easy to create a Gantt chart with structured dependencies that allow teams to allocate resources effectively.
What is the best project management software with Gantt chart?
GoodDay stands out as the best project management software for creating a detailed project timeline with advanced Gantt features. It helps assigned team members coordinate work and track the project’s progress in real time across simple and multi-stage initiatives. Unlike many other project management solutions, GoodDay scales smoothly for complex projects and provides clear visibility across all tasks involved.
What is the best software with Gantt charts for multiple projects?
GoodDay is ideal for managing multiple projects because it centralizes project phases, resource allocation, and progress tracking into one unified system. The platform helps project teams maintain clarity across different workstreams and prevent project delays. Its ability to handle large project scope demands makes it more efficient than other project management tools designed for separate work silos. Teams managing multiple workstreams benefit from GoodDay’s ability to assign tasks, allocate resources, and maintain a consistent project schedule across all initiatives.
Where can I find a waterfall Gantt chart template?
You can find a waterfall Gantt chart template inside GoodDay, where you can create a Gantt chart aligned with structured project phases. It is perfect for any workflow that depends on clear phase boundaries. GoodDay also allows users to make a Gantt chart from scratch using its flexible template system.
Where can I find a website development Gantt chart template?
A website development Gantt chart template is available in GoodDay’s ready-made library. It includes work breakdown structure elements, task durations, and assigned team members to streamline design and development work.
How can team members use Gantt charts to schedule tasks and monitor progress throughout a project?
Team members rely on Gantt charts to coordinate work efficiently because they clearly show which activities project managers expect to be completed at each stage. By checking updated task bars regularly, they can confirm that the project remains aligned with planned milestones and adjust work if delays appear.
What are task bars in a Gantt chart and how do they help visualize the critical path of a project and ensure clear work breakdown structure?
Task bars display the timing and duration of activities and reveal how dependent tasks connect along the critical path. This makes the work breakdown structure easy to understand, showing how each part of the project plan contributes to overall progress.
How do start and end dates in a Gantt chart help define a realistic project timeline?
Start and end dates help teams confirm whether scheduled work fits within the constraints defined by Henry Gantt when he introduced structured project visualization. These boundaries ensure the timeline reflects the actual project scope and prevents unrealistic expectations about delivery.
How can a Gantt chart help project managers allocate resources more efficiently?
A Gantt chart helps resource planning by showing how work overlaps across teams, which is especially valuable in a construction project or software development project that have many moving parts. When used within modern Gantt chart software or broader project management software, it supports agile project management practices and contributes to project success by preventing overloads and ensuring the right people are assigned at the right time.
What problems do Gantt charts solve?
A Gantt chart helps project managers eliminate uncertainty by clarifying project timeline details and making task relationships transparent. It reduces confusion among team members by showing who must complete which work and how the task sequence supports the project’s completion date. Gantt charts help teams to prevent project delays and ensure the entire project progresses smoothly. Because they give a clear view of complex projects, teams maintain better project efficiency and keep everyone on the same page.


