
Turning a plan into action requires both a clear view of what needs to be done and a roadmap for when it must be completed. That’s where a Gantt chart comes in.
It shows tasks on a timeline so teams can easily see what is happening now and what comes next. This visual timeline shows start dates, end dates, durations, dependencies, and progress in a format that is easy to understand at a glance.
In this guide, we will explore how to use a Gantt chart for project management, outline its core elements, and review leading software platforms for building and managing Gantt charts.
At GoodDay, our Gantt charts support all workflow types, from simple task structures to multi stage projects. If you have any questions that are not covered in this article, you can always connect with us via info@goodday.work
Steps to use a Gantt chart
Gantt charts serve both as a planning tool and a communication hub in day-to-day project management. Let’s take a look at the key steps to use a Gantt chart effectively in day to day project management.
1) Define project tasks and scope
Start by clearly defining what the project needs to achieve and what the final result should be. Then break the work into smaller tasks and subtasks so nothing important is missed. For example, instead of one task called “launch website,” split it into design, content, development, testing, and launch.
2) Estimate task durations
Estimate how long each task will take based on past experience (or input from the people doing the work). Be realistic and include extra time for reviews or unexpected delays. For example, if design usually takes one week, plan for eight or nine days instead of five.
3) Set dates and build the timeline
Assign start and end dates to each task and place them on the Gantt chart timeline. Choose a timeline view that matches the project, such as days for short projects or weeks for longer ones. This helps you see the full schedule and spot overlaps or gaps early.
4) Identify task dependencies
Define which tasks depend on others and show these links on the chart. This makes it clear that some work cannot start until earlier tasks are finished. For example, testing cannot begin until development is complete.
5) Assign resources
Assign team members, tools, or budget to each task so responsibilities are clear. This helps everyone know who is doing what and prevents work from being duplicated. For example, one developer may be assigned to backend tasks while another handles frontend work.
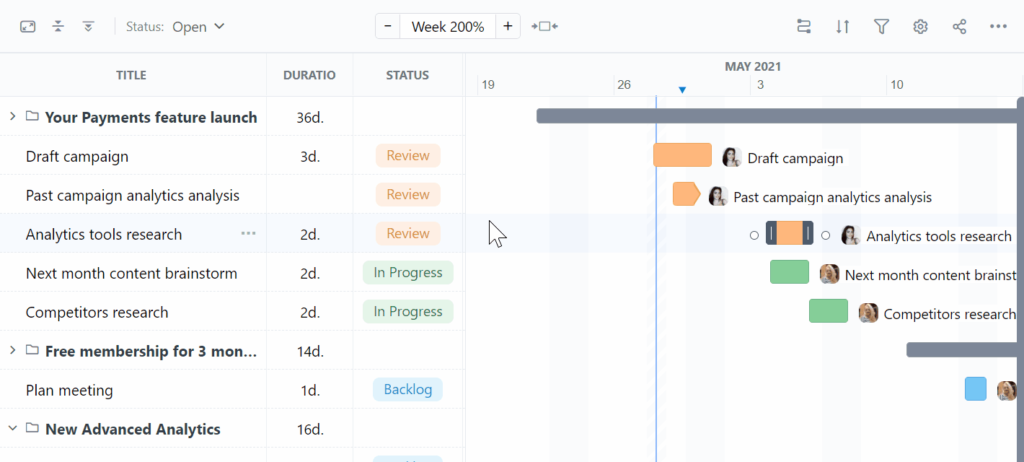
6) Track actual progress
Update the Gantt chart as tasks move forward by marking progress on each bar. This shows what is completed, what is in progress, and what has not started yet. For example, a task bar might be half filled to show that 50 percent of the work is done.
7) Communicate and adjust
Share the Gantt chart with your team and stakeholders so everyone stays aligned. Use it during meetings to explain progress and upcoming work instead of long status reports. When plans change, update the chart so it always reflects the current situation.
Key elements to include into a Gantt chart
A Gantt chart works best when it includes a few core elements that clearly explain what needs to be done, when it happens, and who is responsible.
- Task list: Vertical list of all activities.
- Timeline: Horizontal axis showing time intervals.
- Task bars: Horizontal bars representing task duration and placement.
- Dependencies: Lines/arrows showing task order.
- Milestones: Key project checkpoints (often diamond shapes).
- Resources: Who is responsible for what.
Top 5 Gantt chart software in 2026
Let’s take a look at some of the most reliable tools teams use for Gantt chart planning and tracking today. Each of these tools supports core Gantt chart workflows, but they differ in flexibility and focus.
1) GoodDay
GoodDay is an all-in-one project management platform with deeply configurable Gantt charts used by Fortune 500 companies, startups, and established businesses all over the world. It supports drag and drop scheduling, task dependencies, baselines to compare planned versus actual dates, built in time tracking, and resource workload planning. GoodDay is recognized as a top-rated software in 12 Capterra shortlists.
2) GanttPRO
GanttPRO is built around Gantt chart planning and focuses on visual scheduling. Users can create tasks, set dependencies, define milestones, and see the critical path directly on the timeline. The tool also includes resource workload views and basic cost tracking linked to tasks.
3) TeamGantt
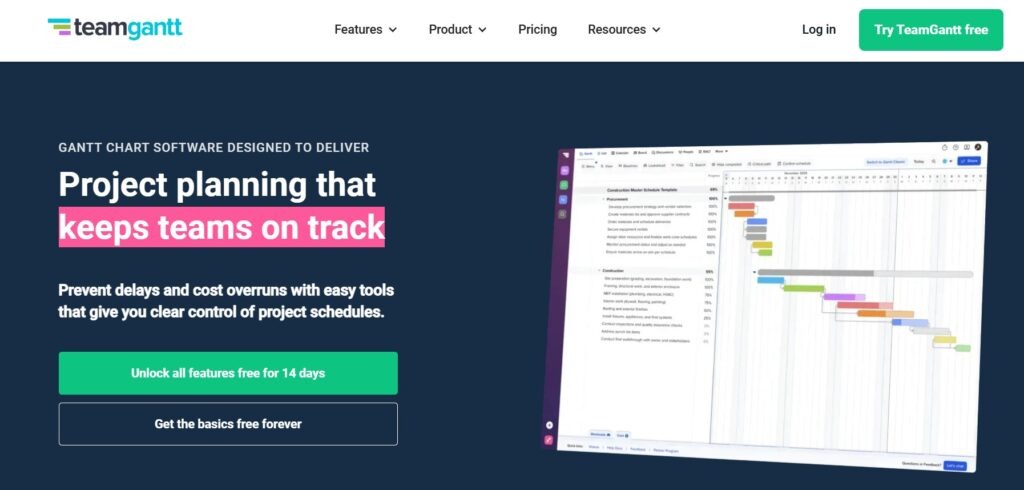
TeamGantt is designed for easy and fast Gantt chart creation without heavy setup. It supports drag and drop task scheduling, dependencies, milestones, and progress tracking in a clean visual layout. The Gantt chart is the main view and is supported by simple list, calendar, and board views for planning flexibility.
4) ClickUp
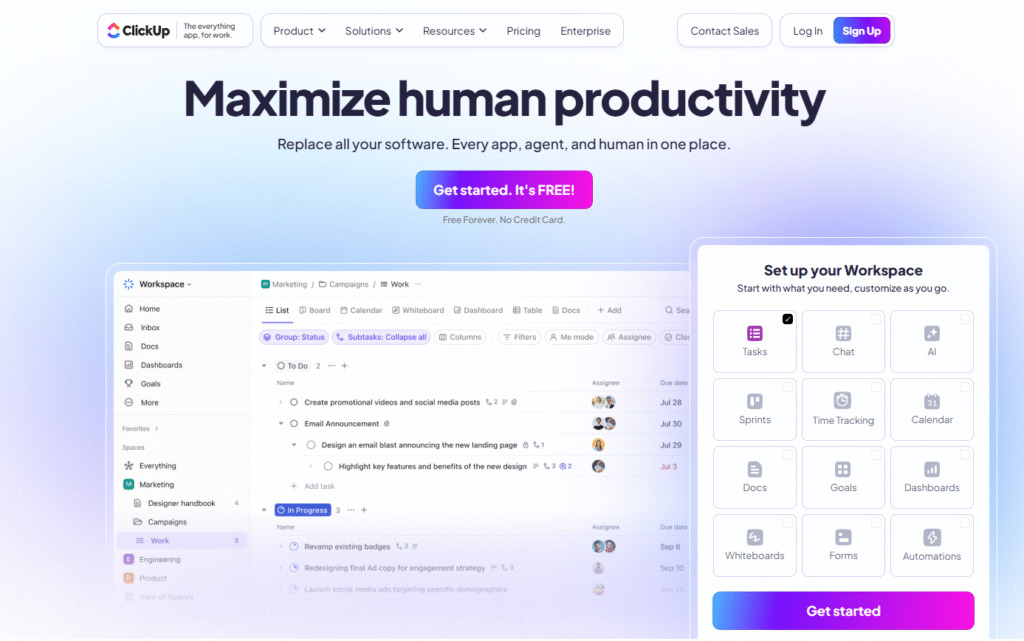
ClickUp includes a Gantt view as part of its broader task and work management platform. The Gantt chart supports task dependencies, milestones, critical path visibility, and automatic date adjustments when schedules change. It also connects with workload and capacity views to help teams balance timelines with available resources.
5) Smartsheet
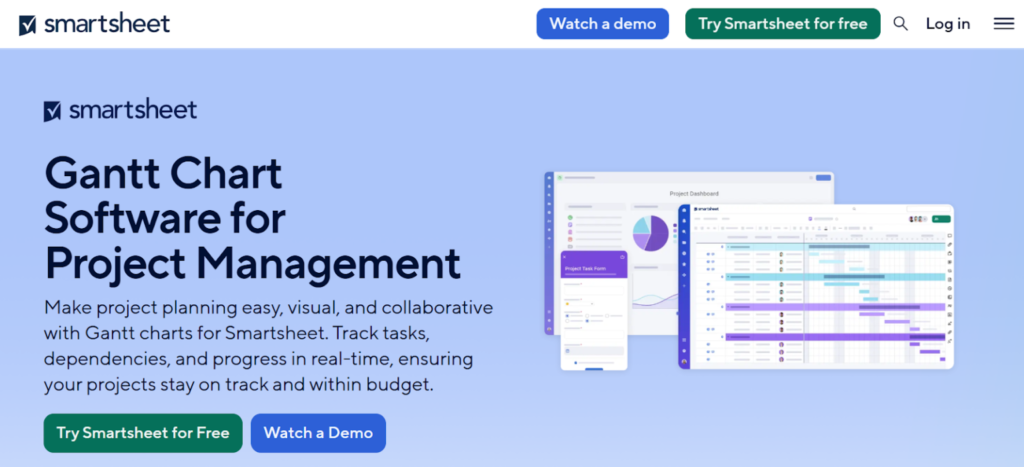
Smartsheet generates Gantt charts from spreadsheet style project data. It supports task dependencies, critical path highlighting, and baseline comparisons to track planned versus actual progress. The Gantt chart stays synced with the underlying sheet, making it useful for teams that prefer structured, table based planning.
How is a Gantt chart used in project management?
Gantt charts were popularized in the early 1900s by engineer Henry Gantt and have since become one of the most widely used tools for planning, coordinating, and tracking projects. People often use Gantt charts not just to draft a project schedule but to monitor progress and adjust plans in response to shifting priorities. Let’s explore some common ways teams use Gantt charts.
Planning project milestones
Teams use a Gantt chart to plan all work before the project starts. Tasks are placed on a timeline so the order and deadlines are clear. This helps avoid confusion from the beginning.
Showing task order
A Gantt chart shows which tasks depend on others. This helps teams know what must be finished first. For example, design must be done before development can begin.
Tracking progress
As work moves forward, the Gantt chart is updated to show progress. This makes it easy to see which tasks are done and which are late. Problems are easier to spot early.
Managing team workload
Gantt charts help managers see who is working on what and when. This prevents giving too much work to one person at the same time. It also helps plan work more fairly across the team.
Sharing project status
Teams use Gantt charts to explain project status during meetings. A quick look at the chart shows progress without long reports. This saves time and keeps discussions clear.
Adjusting plans
When plans change, the Gantt chart can be updated. New dates and tasks can be moved on the timeline. This helps everyone stay aligned even when the project changes.
Create your Gantt chart today
GoodDay’s Gantt charts help teams plan timelines, manage task dependencies, track actual progress against planned dates and balance team workload.
With GoodDay you can create a Gantt chart in just a few minutes.
And if you have questions about setting up your Gantt chart, you can always contact our team at info@goodday.work
Gantt chart FAQs
What are the 7 important elements of a Gantt chart?
The key components of a Gantt chart are a task list, task bars, start and end dates, task durations, task dependencies, project milestones, and resource assignment. Together, these elements show all the tasks and how work is structured over time. They also make task relationships and progress easy to understand. Without these elements, the chart loses clarity and planning value.
How to make a Gantt chart for project management?
To create a Gantt chart, start by defining the project scope and listing individual tasks in the correct task sequence. Then assign start and end dates and link dependent tasks to form a clear project schedule. Modern project managers usually rely on online gantt chart software instead of building an excel gantt chart manually. This approach saves time and reduces errors across complex projects.
What are common mistakes when making a Gantt chart?
A common mistake is adding too many details and making the chart hard to read. Another issue is ignoring task dependencies, which can break the entire project timeline. Teams also forget to update task status, making project progress unclear. When you create a Gantt chart with a structured project management tool, it helps avoid these problems.
How to read a Gantt chart correctly?
Read a Gantt chart from left to right to understand the Gantt chart timeline. Each horizontal bar chart represents task bars showing task durations and timing. Lines between bars show task relationships and dependent tasks. Milestones highlight key points that affect the entire project timeline.
What is the most common use of Gantt charts?
The most common use of Gantt charts is to plan and monitor work across the project life cycle. Teams rely on them to track tasks, visualize the project plan, and identify risks early. They are especially useful for managing multiple projects at the same time.
What are the disadvantages of Gantt charts?
Gantt charts can become cluttered when there are too many project phases or tasks. They also require regular updates to stay accurate. For fast changing work, a simple gantt chart may not reflect reality well. Advanced gantt chart features help reduce these limits.
How detailed should a Gantt chart be?
A Gantt chart should be detailed enough to show manageable tasks without overwhelming the viewer. It should focus on project deliverables rather than tiny actions. The goal is to represent the entire project clearly, not every small step. Well balanced detail improves decision making.
Which tool is best for a Gantt chart?
The best tool is one that combines planning, tracking, and resource allocation in one system. GoodDay stands out by offering advanced Gantt chart features like baselines, critical path, and workload views. This makes choosing Gantt chart software easier for growing teams.
What are the best project management tools?
The best project management software combines task planning, reporting, and collaboration. Some tools focus only on charts, while others integrate gantt charts with other project management tools. GoodDay provides a customizable project management software with strong scheduling and reporting.
How do you track progress using a Gantt chart tool?
Progress is tracked by updating task status directly on task bars. This shows how much of the work is complete compared to planned end dates. Teams can quickly see delays across the entire project. This visual representation improves accountability.
Are Gantt charts still relevant?
Yes, Gantt charts are still widely used by project managers today. They remain effective for planning, communication, and execution. Modern tools integrate Gantt charts into broader workflows.
How does a Gantt chart facilitate project management?
A Gantt chart connects planning and execution in one visual timeline. It helps assign tasks, link tasks, and allocate resources effectively. Managers can identify project milestones and risks early. This improves control over project progress.
What is the main advantage of using a Gantt chart in project scheduling?
The main advantage is seeing the critical path clearly. This shows which tasks affect final delivery dates. Teams can focus attention where delays matter most. It improves schedule reliability.
What is the best Gantt chart software with resource allocation?
For project managers who need full control over planning and workloads, the best option is GoodDay. It works as a visual project management tool that lets teams assign tasks, manage capacity, and keep the project schedule realistic as work changes. GoodDay includes strong key features such as workload views, dependencies, baselines, and real time updates.
Is there a Gantt chart template?
Yes, many tools offer Gantt chart templates. GoodDay provides a ready to use Gantt chart template that is connected to tasks, dependencies, and timelines. It helps teams start faster without building charts from scratch.


