Creating a Gantt chart with ChatGPT is a practical way to speed up project planning. Instead of building timelines manually from scratch, you can use ChatGPT to define tasks, estimate durations, and organize dependencies, then turn that structure into a visual Gantt chart using Excel or project management software like GoodDay.
GoodDay’s Gantt charts provide advanced customization capabilities that work for both simple tasks as well as complex, multi stage projects.
In this guide, we’ll explore how to make a Gantt chart with ChatGPT, which methods you can use, and how to combine ChatGPT with project management software for a complete workflow. And if you have any questions that are not covered in this article, you can always connect with us via info@goodday.work
Can ChatGPT create a Gantt chart? What ChatGPT does in Gantt chart creation
ChatGPT does not create an interactive visual Gantt chart on its own. It works as a planning and structuring assistant. To see and manage the timeline visually, you still need a spreadsheet, a project management tool like GoodDay, or a specialized Gantt chart GPT.
ChatGPT supports the planning stage of a project by organizing clear, structured information needed to build a Gantt chart. ChatGPT can help you:
- break a project into tasks and phases
- estimate task durations
- define task order and dependencies
- structure data in tables or code formats
How to make a Gantt chart with ChatGPT: top 3 methods
Let’s explore top methods of creating a Gantt chart with help of ChatGPT. By utilizing these methods, ChatGPT can significantly speed up the planning phase of your project.
Method 1: Exporting ChatGPT generated data into Excel, Google Sheets, or project management tool like GoodDay
This method gives you a flexible and editable Gantt chart using standard tools. You can use spreadsheets for basic visualization or import data into GoodDay to create a live, interactive Gantt chart.
- Prompt ChatGPT to structure your project plan as a table with the necessary columns.
Example prompt: Generate a project plan as a table with columns for task name, start date, end date, duration, and responsible owner for a marketing campaign.
- Refine the data with follow-up prompts until the plan is complete.
Example prompts: Add task dependencies to this project plan. Add milestones and key delivery dates. Adjust the timeline to fit an eight-week schedule.
- Export or prepare the data for use in another tool.
Example prompt: “Format this project plan so it can be easily imported into Excel, Google Sheets, or a project management tool.”
- Open the data in Microsoft Excel, Google Sheets, or a project management tool like GoodDay.
In Excel, Google Sheets or project management software, you can use a built-in Gantt template or bar chart to visualize the timeline.
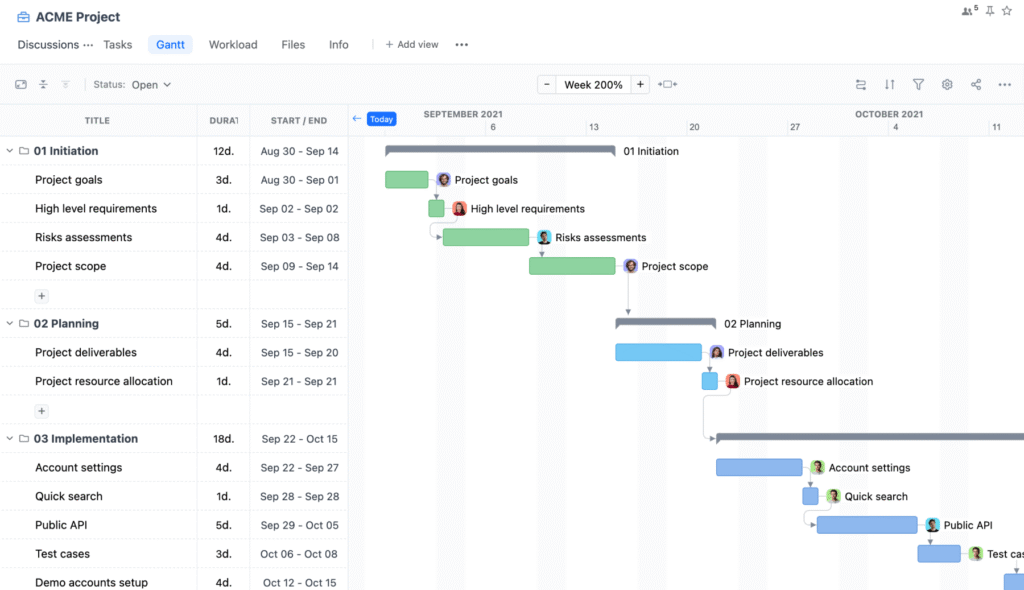
GoodDay’s Gantt chart view provides a clear timeline where you can plan, adjust, and track work in real time. Tasks can be added or imported, dependencies updated with drag-and-drop actions, and the schedule stays automatically synced with progress and changes across the project.
Method 2: Using a dedicated Gantt chart custom GPT (requires ChatGPT Plus)

If you have a ChatGPT Plus subscription, you can use specialized GPTs designed for creating Gantt charts.
- Search for “Gantt chart” in the GPT Store.
- Select a relevant GPT, such as Gantt Chart GPT or Gantt Chart Maker AI.
- Upload your project data, for example an Excel file, or describe your project in plain English.
- Instruct the GPT to generate the Gantt chart.
Depending on the tool, the output may include a structured table, a visual image, or a file that can be opened in Excel or another project management tool.
Method 3. Using Mermaid syntax for a basic diagram
This method is useful when you need a quick and simple Gantt chart image. The result is a static diagram that cannot be edited or updated automatically.
- Prompt ChatGPT to generate a project plan in Mermaid syntax.Example Prompt: “Create a project plan as a Mermaid Gantt chart for a website redesign project, including tasks, start dates, and durations.”
- Copy the code generated by ChatGPT.
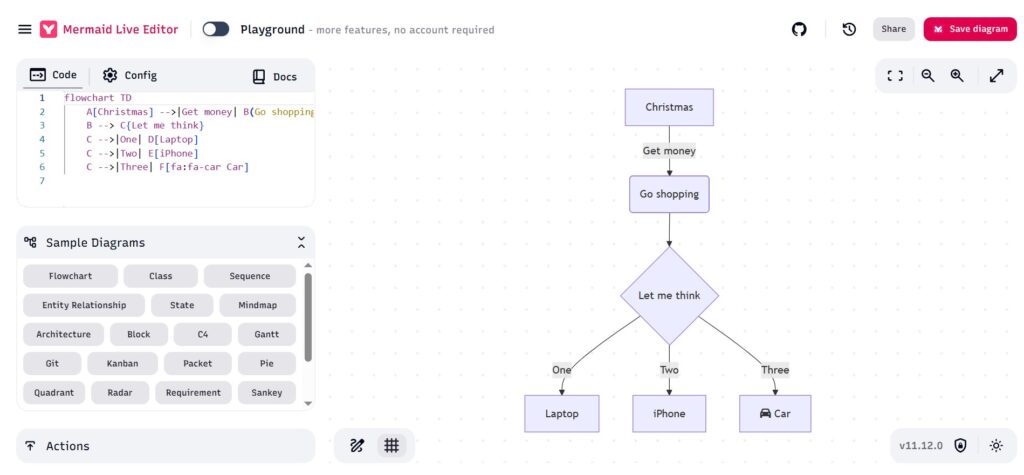
- Use a Mermaid renderer to convert the code into a diagram. Open the Mermaid Live Editor online, paste your code, and you will see the generated Gantt chart.
- Export the chart by saving the image file (e.g., PNG or SVG) from the Live Editor.
This method is best for documentation or presentations, not for managing real project work.
Why ChatGPT works best with a project management software like GoodDay
ChatGPT is excellent for planning a Gantt chart, but projects do not stay static. Tasks move, deadlines change, and teams need a shared view of progress. This is where a project management tool becomes essential.
When you move your ChatGPT-generated plan into GoodDay, your Gantt chart becomes interactive, always up to date, connected to real tasks and easy to adjust when plans change. Turning a ChatGPT plan into a live Gantt chart in GoodDay is simple:
- Use ChatGPT to define tasks, dates, and dependencies.
- Add or import those tasks into GoodDay.
- Open the Gantt view to see the full timeline instantly.
GoodDay automatically keeps the Gantt chart in sync with task updates, progress, and changes made by the team.
Why teams choose GoodDay for Gantt charts
GoodDay is an all-in-one project management platform with deeply configurable Gantt chart functionality used by Fortune 500 companies, scaling startups, and established organizations all over the world. It is recognized as a top-rated software in 12 Capterra shortlists.
The platform is known for its flexible setup options and responsive support team. And its modest price is a standout, you really get a lot for what you pay. With GoodDay, you can:
- drag and adjust tasks directly on the Gantt chart
- manage dependencies without breaking the timeline
- track progress in real time
- connect Gantt charts with tasks, goals, and workload
And if you have questions about creating your Gantt chart or want to explore how GoodDay can support your workflows, feel free to contact our team at info@goodday.work
FAQs
What is a Gantt chart?
A Gantt chart is a visual timeline that shows project tasks, their durations, start and end dates, and dependencies. It helps teams understand how work progresses over time and how tasks relate to one another.
What Gantt chart is used for?
A Gantt chart is used for planning, scheduling, and tracking project timelines. It helps teams manage dependencies, deadlines, and overall progress.
Can ChatGPT create a Gantt chart?
ChatGPT cannot generate an interactive Gantt chart visually, but it can structure tasks, dates, and dependencies. This output can then be imported into spreadsheets or project management software.
Can ChatGPT make a Gantt chart for me?
ChatGPT can help you create Gantt charts by structuring tasks, dates, and dependencies for a clear project timeline. While it does not render a live chart by itself, ChatGPT takes care of the planning logic so you can convert the output into a visual tool. It supports project planning by organizing details, milestones, and resources from a simple description of your work.
How can I generate a Gantt chart?
You can generate a Gantt chart by asking ChatGPT to gather tasks, durations, and dependencies, then refine them into a clean table. From there, you fill a spreadsheet or project app and assign tasks across a defined workflow. This method works well for marketing, development, and sales projects that need clear connections and quality control. It also supports adjustments as scope changes and new risk appears.
Can AI create a Gantt chart?
Yes, AI can plan and structure Gantt data by turning an idea into an actionable timeline. It helps teams create Gantt charts that include milestones, dependencies, and ownership without manual setup. This is especially useful for business teams that need speed, clarity, and measurable benefits. Many teams start free and later scale as needs grow.
Can ChatGPT create charts?
ChatGPT can generate structured data and code that tools use to display charts, including Gantt formats. Using artificial intelligence, it explains the process and provides a repeatable technique to build timelines from one task to many. It also supports sharing information by preparing tables that teams can collaborate on with stakeholders. The result is a practical way to automate planning steps and reduce error.
Can AI create visualizations?
AI tools can prepare data for visualizations, while dedicated software like GoodDay renders the final chart view. ChatGPT focuses on planning so teams can launch faster and support collaboration across roles. For a business, this means AI can generate structured timelines while teams focus on execution instead of setup. It also helps teams think through a project challenge early and organize the right resources. Clear inputs and supporting materials make the visualization process faster and more reliable.
Can ChatGPT make visualizations?
ChatGPT can output formats used by visualization tools, including tables and scripts, but it does not host interactive visuals itself. It is often paired with a tutorial, video, or app menu to show next steps and confirm the sign of readiness. Teams use prepared materials to align stakeholders and keep connections clear. This balance improves productivity while maintaining planning accuracy.
How to create a simple Gantt chart?
List tasks, define start dates and durations, and map them on a timeline. You can create a simple Gantt chart using Excel, Google Sheets, or a project management tool.
How to use a Gantt chart?
Use a Gantt chart to plan task order, monitor progress, and adjust schedules as changes occur. It is especially useful for spotting delays and dependency risks early.
What are the best Gantt chart tools?
Popular Gantt chart tools include GoodDay, Microsoft Project, Wrike, Smartsheet, and ClickUp. Cloud-based tools are usually preferred for flexibility and collaboration.
What is the best Gantt chart tool for team collaboration?
GoodDay is one of the best tools for team collaboration because its Gantt charts stay synced with live task updates. Teams can collaborate without breaking dependencies or timelines.
What is the best PM software for timeline and Gantt views?
GoodDay stands out for timeline and Gantt views due to its flexibility and real-time updates. It supports both simple schedules and complex project structures.
What is the best Gantt chart software for product teams?
Product teams benefit from tools like GoodDay that combine Gantt charts with roadmaps and workflows. This supports both planning and execution in one platform.
What is the best software for aligning Gantt views with resource capacity?
GoodDay aligns Gantt views with resource capacity through built-in workload and availability tracking. This helps teams avoid overloading people and resources.
What is the best software to align Gantt views with resource capacity?
Project management platforms with integrated workload management, such as GoodDay, perform this best. They keep timelines and team capacity aligned automatically.
What project management software can make Gantt charts?
Many project management tools support Gantt charts, including GoodDay, Microsoft Project, Wrike, and Smartsheet. These tools offer easy setup and configuration.
What is the best project management software for timeline and Gantt views?
GoodDay is a strong choice because it offers customizable timelines and interactive Gantt charts. It balances advanced functionality with ease of use.
What are the best Gantt tools for real-time collaboration?
The best Gantt tools for real-time collaboration are cloud platforms like GoodDay and Wrike. They update timelines instantly as tasks change.
What are the best platforms for Gantt-based multi-project planning?
GoodDay works great for Gantt-based multi-project planning with shared timelines and resources. This is ideal for teams managing multiple initiatives at once.
What are the best platforms for managing dependencies with Gantt views?
Platforms such as GoodDay and Microsoft Project offer strong dependency management. They allow timeline adjustments without breaking linked tasks.
How can I make a Gantt chart for production planning?
Break production into stages, define task durations and dependencies, and place them on a timeline. A Gantt-enabled project management tool makes updates and tracking easier.
What is the best Gantt-enabled project software?
GoodDay is a leading Gantt-enabled project software for teams of different sizes. It offers deep configuration without excessive complexity.
What is the best drag-and-drop Gantt chart editing software?
GoodDay provides smooth drag-and-drop editing directly on the Gantt chart. Changes instantly update dates, tasks, and dependencies.
What is the best Gantt chart project management software?
GoodDay is widely considered one of the best Gantt chart project management tools. It supports both planning and execution in a single system.
How to make a Gantt chart?
Define tasks, assign dates and durations, set dependencies, and visualize them on a timeline. You can do this using spreadsheets or project management software.
What are the best project tools with interactive Gantt charts?
Tools like GoodDay, Wrike, and Smartsheet offer fully interactive Gantt charts. They allow real-time editing and progress tracking.
What are the top platforms that combine dashboards with Gantt and Kanban views?
GoodDay and ClickUp combine dashboards, Gantt charts, and Kanban boards in one platform. This gives teams multiple views of the same project data.
What is the best Gantt chart project management tool?
GoodDay is often chosen as the best Gantt chart project management tool for modern teams. It adapts well to different workflows and industries.
How to use ChatGPT in project management?
ChatGPT helps define tasks, estimate timelines, and structure project plans. Teams use it to speed up planning before moving work into project management software.


