
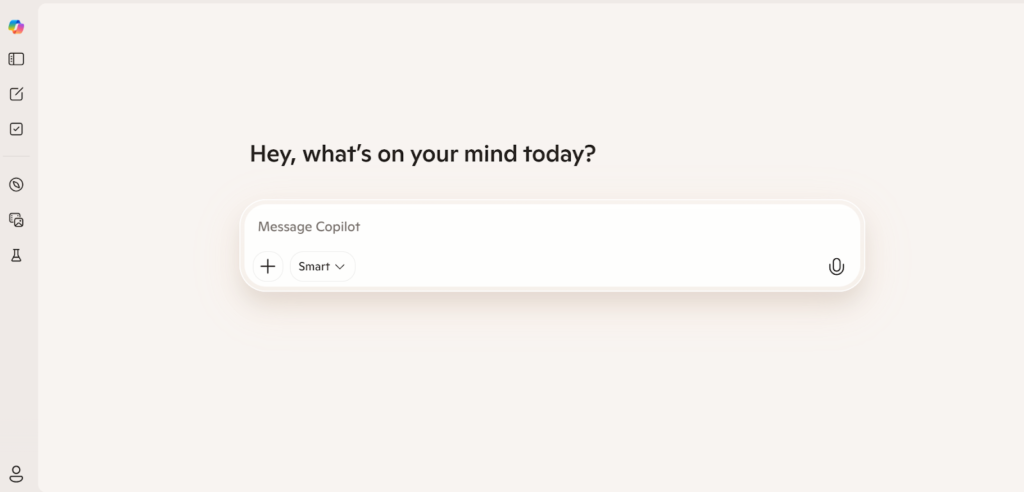
Microsoft Copilot is an AI assistant built into Microsoft 365 that uses large language models to help generate, organize, and refine content. Instead of starting from scratch in a spreadsheet or project tool, you can ask Copilot to outline your project structure, list tasks with dates, and format the results into a table.
Copilot works directly with Microsoft apps like Excel, so once it generates your schedule, you can easily convert that data into a Gantt chart using built-in Excel chart tools.
However, Excel-based Gantt charts are static and require manual updates. For ongoing project management, you can move the same task list into GoodDay and switch to Gantt view. This allows you to manage dependencies, adjust timelines with drag-and-drop editing and track progress in real time.
In this guide, we’ll walk you through step-by-step how to use Copilot to create a Gantt chart. But if you have any questions that are not covered in this article, you can always reach out to our team at info@goodday.work
Steps to create a Gantt chart with Microsoft Copilot
Microsoft Copilot can help you turn a simple task list into a visual timeline directly inside Excel. Here is how to prepare your data and create a working Gantt chart that you can refine as your project evolves.
Step 1: Prepare your data
Open Excel and create columns for Task Name, Start Date, and Duration. Enter all tasks with accurate dates and estimated timeframes.
Step 2: Format your data as a table
Select the data range and press Ctrl+T to format it as a table. This allows Copilot to properly recognize and analyze your structure.
Step 3: Activate Copilot
Click the Copilot button in the Excel ribbon. This opens the assistant panel where you can enter your request.
Step 4: Enter a clear prompt
Type a specific instruction such as: “Create a Gantt chart using this data.” The clearer your request, the better the result.
Step 5: Insert the generated chart
Review the chart created by Copilot. If it looks correct, select “+ Add to a new sheet” to insert it into your workbook.
Step 6: Move your schedule into a project management tool
Excel Gantt charts are static and require manual updates when timelines change. To manage dependencies, track progress, and coordinate teams, move your task list into a project management platform like GoodDay.
Why teams choose GoodDay to create Gantt charts
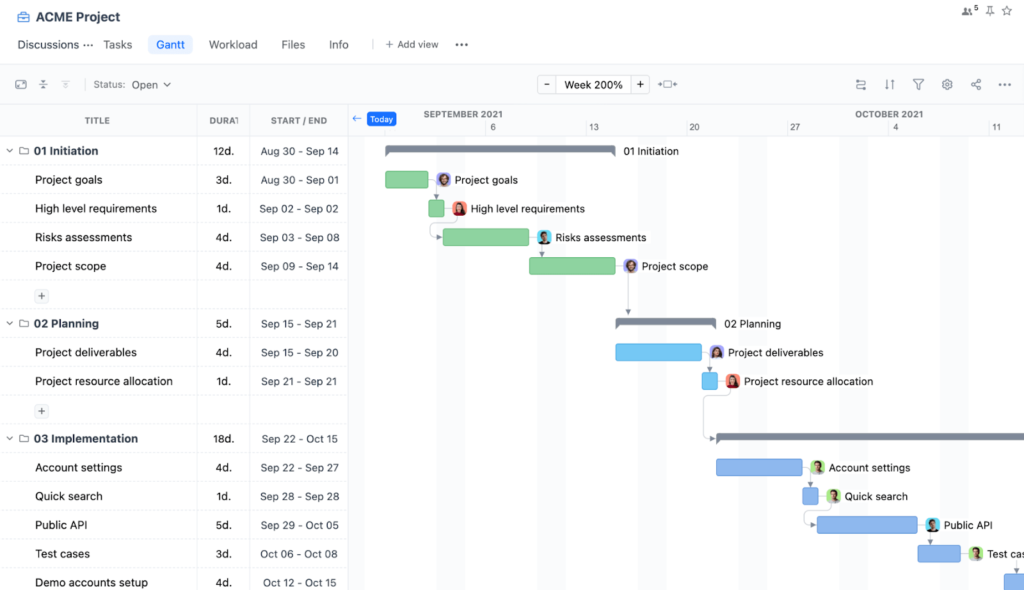
GoodDay is a comprehensive project management software with powerful Gantt charts. It is trusted by Fortune 500 companies, growing startups, and established organizations worldwide. The platform has been recognized as top software in 12 Capterra shortlists.
With GoodDay, you can:
- Manage dependencies
- Drag and reschedule tasks directly on the Gantt timeline
- Connect Gantt charts to goals, tasks, and team workload
- Plan and monitor multiple projects in one unified view
- Track progress in real time
Teams choose GoodDay because its Gantt view is fully connected to real project data. Changes made on the timeline automatically update tasks, workloads, and progress.
If you have questions about building your Gantt chart or would like to explore how GoodDay can support your workflows, you can always contact our team at info@goodday.work
FAQs
Can Copilot help me create a Gantt chart?
Yes, Microsoft Copilot can help create charts inside Microsoft Excel when your data is properly structured. By entering clear prompts, it can generate a Gantt-style timeline from a formatted table. The result is helpful for visualization but remains spreadsheet-based. For advanced planning and tracking, GoodDay provides stronger built-in Gantt functionality.
Can Copilot generate a chart?
Copilot can create charts directly from organized data in Microsoft Excel. It interprets natural language prompts and converts table data into visual output. This makes it easier to save time when preparing timelines or summaries. However, these visuals do not automatically manage updates across larger workflows.
Can Copilot create a project schedule?
Copilot can draft a project plan by organizing specific tasks into a structured table. It can suggest timelines and arrange data clearly for review. The schedule must still be reviewed and adjusted manually. Dedicated project management platforms offer more control over ongoing updates.
Does Copilot have a project management tool?
Copilot is an AI assistant integrated into Microsoft 365 applications. It does not function as a standalone project management system. It helps with drafting, formatting, and data analysis tasks. For full-scale coordination, GoodDay is designed specifically as project management software.
What’s the best tool to create a Gantt chart?
Microsoft Excel can be used to build a Gantt chart based on formatted data. However, managing task dependencies, updates, and workload planning requires more specialized functionality. GoodDay provides interactive Gantt charts connected to tasks, goals, and team activity. It is built to support structured project tracking at scale.
Is Copilot the same as ChatGPT?
Copilot and ChatGPT both use AI technology, but they serve different purposes. Copilot is embedded within Microsoft applications, while ChatGPT is a standalone conversational assistant. Their workflows and integrations differ even though both rely on advanced AI models. Each tool supports different use cases.
How do I organize project tasks before creating a Gantt chart?
Start by listing all project tasks with clear start dates and durations. Break large goals into smaller, manageable items to improve clarity. Structure the data in a clear table format before generating the timeline. This preparation improves accuracy and reduces confusion later.
How can I track project progress using a Gantt chart?
A Gantt chart helps you track project progress by showing completion percentages across tasks. It provides a visual overview of project status and highlights delays. Monitoring the critical path helps identify which tasks directly affect deadlines. GoodDay updates progress automatically when tasks change.
Can Copilot automatically create charts from my task list?
Yes, Copilot can create charts from structured data when you provide clear prompts. It uses your formatted column layout to build visual outputs. The generated chart can then be edited inside Excel. For more advanced dependency management, project management software is more suitable.
How to turn meeting notes into action items and add them to a Gantt chart?
You can use AI tools to extract action items from meeting notes. After identifying tasks, add them into a structured table with dates and durations. Then convert that data into a timeline view. In GoodDay, those tasks can be directly connected to dependencies and tracked over time.
How do project managers use Gantt charts for planning and reporting?
Project managers rely on Gantt charts to plan timelines and monitor dependencies. They generate reports to share updates with stakeholders and provide an executive summary. These visuals help highlight priorities and potential risk areas. GoodDay simplifies reporting with customizable dashboards and timeline views.
How does a Gantt chart improve resource allocation across multiple tasks?
A Gantt chart improves resource allocation by showing how resources are distributed across tasks. It helps identify when a team member is overloaded or underutilized. This visibility supports better scheduling decisions. GoodDay provides a unified view across projects to optimize resource allocation effectively.


