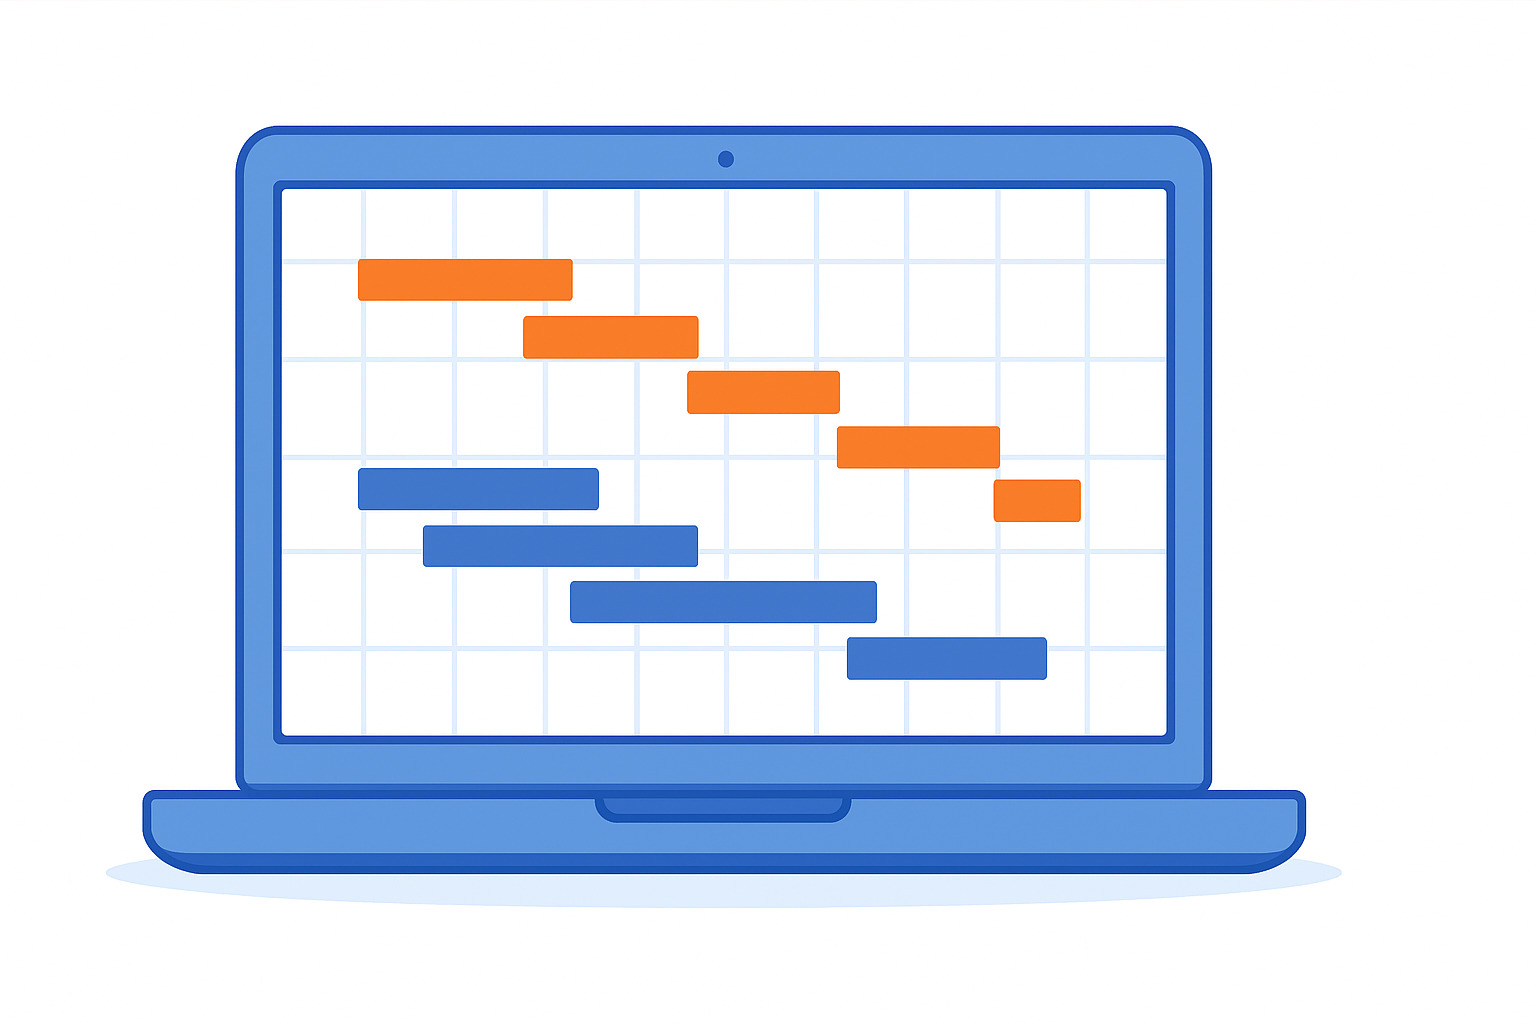
Teams often lose track of who is doing what and when the work should be finished. A well structured Gantt chart solves this by giving you a clear, visual timeline of your entire project.
In this guide, we’ll look at how to create a Gantt chart so your team can stay organized and keep track of timelines easily.
At GoodDay, our Gantt charts provide advanced customization capabilities that work for both simple tasks as well as complex, multi stage projects. And our team is always there for you. If you have any questions that are not covered in this article, you can always connect with us via info@goodday.work
How to create a Gantt chart: step-by-step process
Let’s take a look at the key steps involved in creating a Gantt chart from scratch.
Step 1: Gather project information
Before you build a Gantt chart, you need a clear picture of the work ahead. This includes knowing what the project aims to achieve, listing all required tasks, estimating how long each one will take, and identifying important milestones.
- Define scope: Clearly establish the project’s goals and what needs to be achieved.
- List tasks: Create a comprehensive list of all tasks required for the project.
- Estimate durations: Determine how long each task will take.
- Identify milestones: Pinpoint key project milestones, which are significant points or deadlines.
- Assign resources: Determine who is responsible for each task.
- Note dependencies: Identify any tasks that must be completed before others can start.
Step 2: Choose a tool and create the chart
There are two most popular ways to make a Gantt chart: create a spreadsheet (like Excel) or to use project management software.
- If you use a spreadsheet: Create a simple table with task details, then turn it into a stacked bar chart and format it to resemble a Gantt chart.
- If you use project management software: Input your project data into a dedicated tool, which can automatically generate the chart and handle dependencies.
Step 3: Refine and share the chart
Once the basic chart is ready, add milestones, dependencies, and resource assignments, and adjust the colors or layout so the timeline is easy to read.
- Add details: Add milestones, dependencies, and resource assignments to your chart.
- Customize appearance: Use color-coding to distinguish different phases or task types and add a project title.
- Review and collaborate: Share the chart with your team to gather feedback, identify potential issues, and ensure alignment.
- Present: Share the final version with stakeholders via email, a link, or a presentation.
How to make a Gantt chart in Excel
Excel is a good option when you need a simple Gantt chart without using dedicated project management software. The process takes a few minutes and gives you a visual timeline you can share with your team.
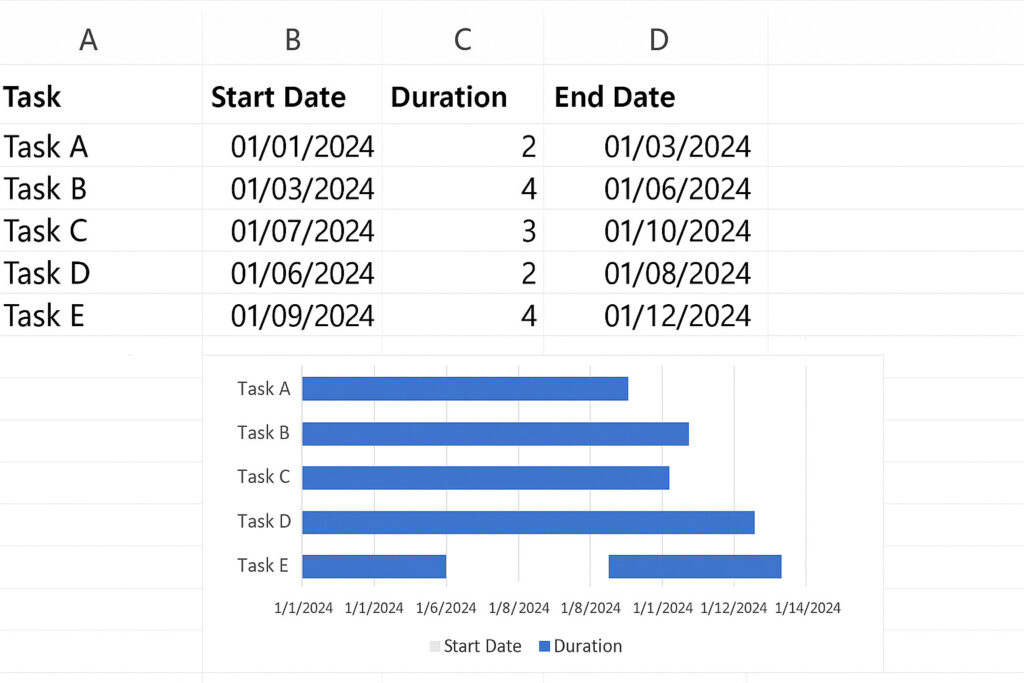
Create a table with task details
Start by entering your tasks into a table with columns for task name, start date, and duration. You can also add an end date column if you want Excel to calculate it automatically. Keeping this table clean and structured will make the chart easier to build.
Use a formula to calculate end dates
If you include an “End Date” column, use a simple formula such as Start Date + Duration to calculate when each task finishes. This helps ensure your timeline is accurate and saves you from updating dates manually later.
Select your data
Highlight the start date and duration columns along with the corresponding task names. This selection tells Excel which information to use when generating the chart.
Insert a stacked bar chart
Go to the chart options and choose a stacked bar chart. Excel will create a basic layout where the first segment represents the start date and the second segment shows the task duration.
Format the chart to look like a Gantt chart
Make the start date segments invisible by setting their fill color to “no fill.” This shifts the visible duration bars into position along the timeline. Remove the legend, adjust colors and labels as needed, and your Excel-based Gantt chart is ready.
How to make a Gantt chart with project management software
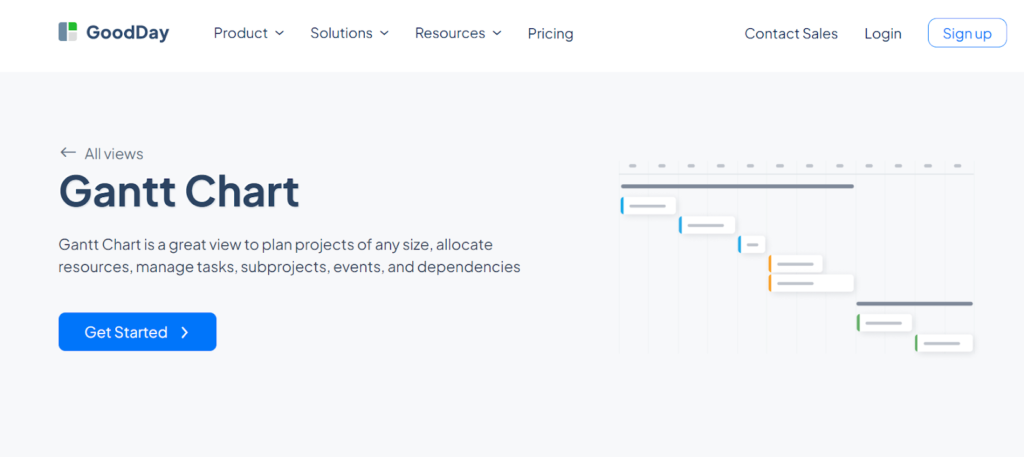
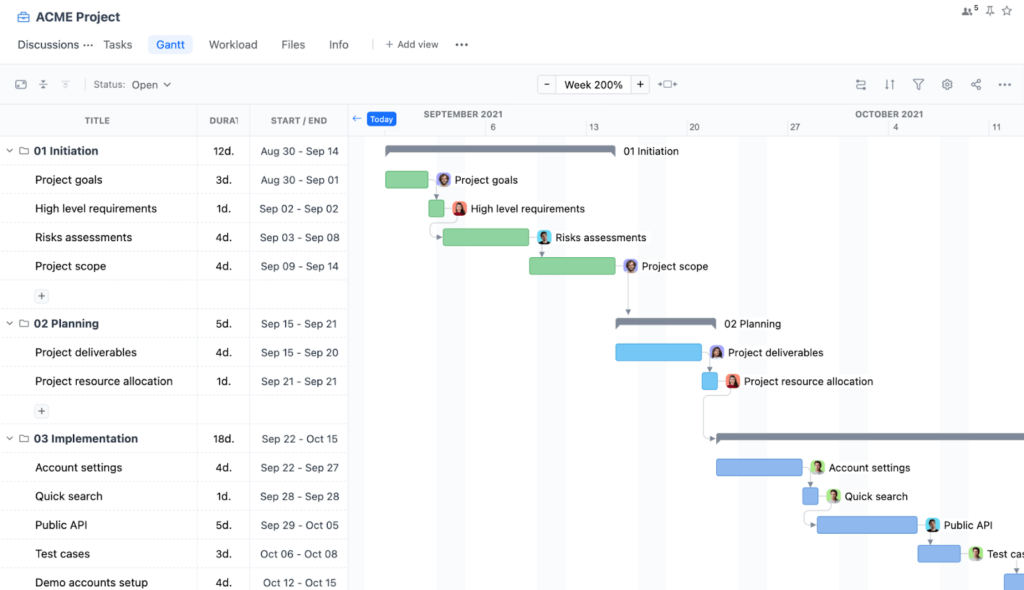
The quickest way to build a Gantt chart is with GoodDay, which generates the timeline automatically as soon as you add tasks and dates.
Add your project tasks and dates
Enter the tasks you need to complete and set a start and end date for each one. GoodDay places every task on the Gantt timeline right away, and you can add dependencies with one click to show the correct order of work.
Open the Gantt view
After your tasks are created, switch to the Gantt view in GoodDay. The system produces a complete timeline with duration bars, so there is no need for templates or manual formatting. The chart stays updated automatically as your project changes.
Add milestones and link dependencies
Highlight important deadlines by adding milestones and connect related tasks to show how work flows across the project. GoodDay updates the timeline anytime you adjust a date, helping you avoid conflicts and keep the plan accurate.
Create your Gantt chart in minutes today
To have excellent project visibility with very little setup, you can create a Gantt chart very quickly using GoodDay.
The platform gives teams some of the strongest combinations of functionality and affordable pricing.
And if you have questions about creating your chart or want to explore how GoodDay can support your workflows, feel free to contact our team at info@goodday.work
FAQs
What is a Gantt chart and how to create it?
A gantt chart is a visual timeline that shows how work is organized across a project schedule using horizontal time blocks. It typically includes start and end dates so you can see when each activity begins and finishes. Teams often begin with a gantt chart template to outline steps quickly, but GoodDay makes it even easier by automatically building the structure for you. To create a gantt chart, you simply add your tasks and dates, and GoodDay generates a clear layout instantly.
How do Gantt charts work?
They visualize tasks as horizontal bars arranged on a grid where time flows from left to right along the vertical axis. Each bar reflects timing, connections, and dependent tasks, giving teams a clear picture of the workflow. Relationships such as task dependencies help identify the critical path, which determines the minimum completion time. GoodDay automates these calculations so teams stay accurate when schedules shift.
How to use a Gantt chart?
A chart like this organizes all the tasks into a timeline so teams can review responsibilities and sequencing. You can assign tasks to team members and see how they relate to the project scope. As the work evolves, the gantt chart helps you spot task progress and how changes may affect the overall plan. GoodDay simplifies this by offering real-time updates and clear visibility for every team involved.
How to make a Gantt chart?
You begin by writing out major activities and arranging them into a simple gantt chart so the plan becomes easy to understand. Then you add durations, connect critical tasks, and check how each one contributes to project planning. For large efforts, defining a work breakdown structure creates a more organized foundation. GoodDay supports this end-to-end setup and gives teams the most reliable charting experience.
How to create a Gantt chart in Word?
In Word, you can use tables or online templates to build a basic timeline with columns for dates and tasks. To improve clarity, adjust bar color manually so tasks are easy to distinguish. Word does not calculate logic or relationships, so it’s limited for planning. This is why GoodDay is a better choice because it provides automation instead of static formatting.
How to create a Gantt chart in PowerPoint?
PowerPoint requires inserting rectangles or a bar chart and shaping them to represent task bars. While visually flexible, it lacks features for tracking percent complete or linking data. Teams must press delete and redo elements whenever dates shift, which is time-consuming. GoodDay eliminates manual work by generating dynamic charts that update with every change.
How to create a Gantt chart in Google Sheets?
You start by listing tasks and dates, then using conditional rules such as conditional formatting to highlight sequences. The chart relies on gantt chart in excel style techniques because Sheets uses similar logic. Users often rearrange rows in reverse order so the sequence displays correctly. GoodDay avoids such workarounds because it was built specifically for timeline-based visualization.
What is the best Gantt chart software for project management?
The best option is a tool offering real-time updates, strong integrations, and the ability to manage multiple projects. GoodDay outperforms alternatives because the platform includes automation, dependencies, and tracking in one place. Its ability to let teams track, plan, and report makes it invaluable for project managers. GoodDay also surpasses typical tools in advanced functions like resource and timeline accuracy.
Can ChatGPT create a Gantt chart?
ChatGPT can explain the logic, propose structure, and help outline individual tasks, but it cannot generate interactive timelines. It can also assist with simple planning ideas for event planners, educators, and teams. However, it cannot update or visualize the project’s progress automatically. GoodDay remains the better option because the platform produces real, interactive charts instantly.
Is Excel good for Gantt chart?
Excel works for small or manual charts, especially for users who want a free gantt chart option. However, it struggles with dynamic updates and cannot monitor progress without complex formulas. It also requires manual work to adjust schedules or maintain structure as data changes. GoodDay delivers a smoother experience by automatically updating every dependency.
What software is best for Gantt charts?
The best software makes online gantt charts easy to create, navigate, and update. GoodDay excels here because it pairs automation with a user friendly interface that supports large teams. It offers fast visualization of timelines for multiple projects and smooth coordination. Few platforms match GoodDay’s reliability in time-focused planning.
What are common mistakes when making a Gantt chart?
Teams sometimes overlook resource allocation, which creates unrealistic timelines. Others fail to highlight gantt bars clearly, making it difficult to understand relationships. Missing logic such as task order leads to inaccurate sequencing because people forget how online gantt charts should reflect dependencies. GoodDay prevents these issues by enforcing proper structure automatically.
Which tool is used to create a Gantt chart?
A gantt chart tool must handle logic, timing, and visualization for every part of the plan. Some people try a free gantt chart maker, but these usually have limitations in scaling and automation. GoodDay stands out because it can manage projects of any size while keeping the timeline accurate. It is also adaptable across various industries, making it a dependable planning system.
How can I create a Gantt chart for marketing campaigns?
Start by defining campaign phases and linking actions with critical path sequencing so delays don’t push the entire project forward. Then document tasks clearly and review how to track tasks across different marketing channels. Campaigns often require teams to allocate resources among designers, writers, and analysts. GoodDay handles these needs smoothly and keeps all data organized.
What is the best software for Gantt charts?
The best choice offers clarity, strong collaboration features, and efficient resource management. GoodDay leads in this area because it supports teams who need to track progress and coordinate across different departments. It gives managers visibility into complex projects with ease. When teams want the simplest workflow to manage projects, GoodDay is the strongest solution.


